Total household debt was roughly flat in the second quarter of 2020, according to the latest Quarterly Report on Household Debt and Credit from the New York Fed’s Center for Microeconomic Data. But, for the first time, the dynamics in household debt balances were driven primarily by a sharp decline in credit card balances, as consumer spending plummeted. In an effort to gain greater clarity, the New York Fed and the Federal Reserve System have acquired monthly updates for the New York Fed Consumer Credit Panel, based on anonymized Equifax credit report data. We’ve been closely watching the data as they roll in, and here we present six key takeaways on the consumer balance sheet in the months since COVID-19 hit.
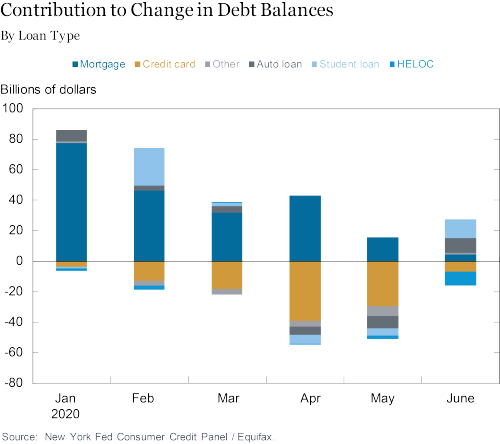
1. Growth in Household debt balances has stalled—mainly due to a decline in credit card balances.
Mortgages crept up, and student loans and auto loans remained roughly flat in the second quarter. HELOCs, which we initially suspected may be used as a source of liquidity for cash-strapped borrowers, have instead retreated. Credit card balances typically see declines in the first quarter, following a bump in the fourth quarter due to holiday spending (although note that our data show total outstanding balances, including those that will be paid off after the statement and those carried over from the previous month). But declines in credit card balances in the second quarter of any year have, thus far, only been seen during the Great Recession, and the magnitude of the $82 billion decline in the second quarter of this year is unprecedented since at least 2000.
2. Foreclosures have screeched to a halt.
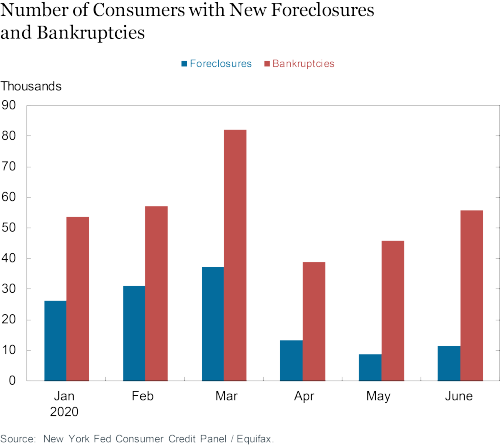
A moratorium on foreclosures was provided as part of the CARES Act. Foreclosures—which were at historic lows before the pandemic hit, have stopped almost entirely, and we simply are not seeing new foreclosures on consumer credit reports (those that remain are likely to have started prior to the moratorium). Bankruptcy filings, by contrast, slowed down sharply in April when most courts were closed, but have trickled up slowly a bit since.
3. The CARES Act provided forbearances on mortgage payments, but the uptake on forbearances has been mixed and varies by type of mortgage.
The CARES Act also provided forbearances on mortgage payments, permitting borrowers of Federally-guaranteed mortgages to pause repayment for 180 days. Now that we are able to observe participation, we see that overall, 7.0 percent of first mortgages appear to be in forbearance. However, that share varies by lender type of mortgage; 12.5 percent of FHA and VA mortgages were in forbearance as of June 2020, compared to 5.5 percent of Freddie Mac and Fannie Mae mortgages. Among the rest of the first mortgages, which primarily includes loans held in portfolios and those in private label securities, 5.7 percent were in forbearance. The payments on the $730 billion mortgage balances are being deferred at about $6 billion per month with interest waived—a significant transfer to homeowners that may be used to increase consumption elsewhere or to pay down other types of debt.
Auto loans, for which the provision of forbearances was not mandatory through the CARES Act, also saw a number of borrowers in forbearance or deferments. Approximately 5.9 percent of auto loans indicated that the borrowers had zero required scheduled payments. Forbearances are more common among younger borrowers; with 6.8 percent of borrowers under age 40 in forbearance. By comparison, 4.4 percent of auto loan borrowers over age 60 are in forbearance. When we tally forbearance participation rates by the income ranking of the zip code of the borrowers, we find that 6.4 percent of auto loans in the highest- and lowest-income quartiles are in forbearance, compared to 5.4 percent in the zip codes that fall in the 25th-75th percentiles of income.
4. Delinquency rates are declining as troubled borrowers opt for forbearance.
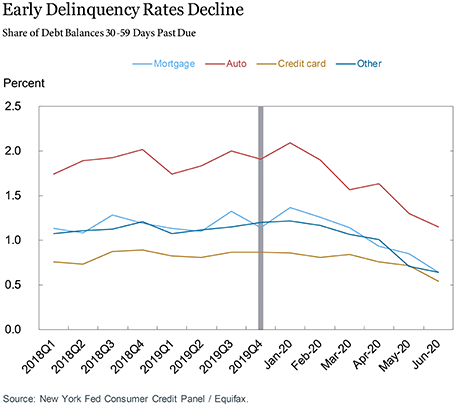
The take up of forbearances, due to both CARES-provided forbearances and those voluntarily provided by lenders, contributed to a decline in delinquency rates. The rate of delinquencies declined for mortgages, auto loans, and credit cards as indicated by the share of 30-59 days past due balances, as seen in the chart below. Consequently, our preferred quarterly measure of debt performance—the share of loans that transition into delinquency from current status—has also declined for these types of debts, which is visible on page 13 of the Quarterly Report on Household Debt and Credit.
5. Nearly all student loan borrowers were rolled into forbearance and troubled borrowers’ were given a (temporary) fresh start.
Following the enactment of the CARES Act, federal direct student loan borrowers were all automatically placed in forbearance, which is provided until September 30. Further, interest on federal student loans is waived during this period. We find that approximately 88 percent of student loan borrowers (which includes private loan and Federal Family Education Loan borrowers) had a scheduled payment of $0. Not all of these borrowers are in new forbearances, thus the 88 percent includes currently enrolled students, those in grace periods, as well as some borrowers in income-driven repayment programs with no payment due.
The treatment on credit reports of delinquent federal student loans in forbearance has been different than forbearances of other loan types. Most delinquent loans (but not in default) are now being reported as current; defaulted loans have retained their status, although collections are paused. Consequently, the student loan delinquency rate, which is seen on page 12 of the Quarterly Report on Household Debt and Credit, has fallen by roughly half (and the drop in student loan delinquency rates is also largely responsible for the drop in overall household debt delinquency rates on page 11). As a result, the average credit score of all student loan borrowers has increased from 647 in March to 656 in June, primarily initiated by the “curing” of delinquent loans as they entered forbearance.
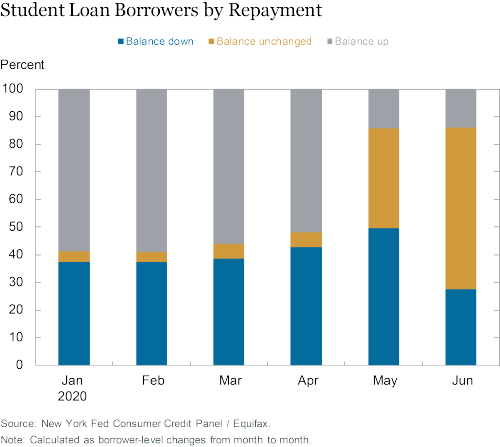
Further, with forbearances having been rolled out nearly universally, not surprisingly, the repayment rates of student loans have declined sharply. In the chart below, we show the share of borrowers with declining balances as they pay their loans back (in blue ) and with increasing balances (in gray). A smaller share of student loan borrowers are actively reducing their balances. And as interest on student loans is waived, a smaller share of borrowers are seeing an increase in balances. The growing gold segments indicate that with interest waived and payments deferred, the majority of borrowers saw no change in balances from May to June.
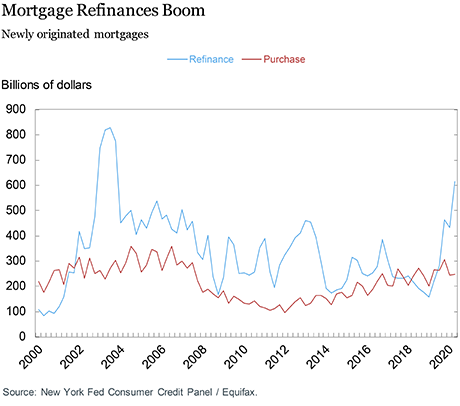
6. Mortgage refinances have surged, as mortgage interest rates touched historic lows. Refinancing is an attractive option for homeowners.
Thus the total mortgage origination volume in the second quarter surged, up to $846 billion, from already high levels in the first quarter of 2020 and the fourth quarter of 2019, driven by large number of refinances, shown in the chart below. But, page 7 of the Quarterly Report shows the median credit score of newly originated mortgages is at 784, the highest we’ve seen since our data begin in 2000, indicating the availability and take-up of refinancing has been concentrated among high credit score borrowers.
In summary, most recent data from our Consumer Credit Panel reveal a complex picture: American households have dialed back consumption and reduced their credit card balances, while forbearances have provided relief to many borrowers who need it. These consumer protections have helped prevent large-scale spikes in delinquency of American household borrowers, while at the same time masking the economic hardship that many households are experiencing following job loss. How households fare going forward will depend on the evolution of the pandemic and labor market, as well as on the extent and nature of future forbearance provisions and other government assistance. We’ll be closely monitoring the financial health of American households going forward as our monthly updates of the Consumer Credit Panel roll in.
 Andrew F. Haughwout is a senior vice president in the Federal Reserve Bank of New York’s Research and Statistics Group.
 Donghoon Lee is an officer in the Bank’s Research and Statistics Group.
 Joelle Scally is a senior data strategist in the Bank’s Research and Statistics Group.
 Wilbert van der Klaauw is a senior vice president in the Bank’s Research and Statistics Group.
How to cite this post:
Andrew F. Haughwout, Donghoon Lee, Joelle Scally, and Wilbert van der Klaauw, “A Monthly Peek into Americans’ Credit During the COVID-19 Pandemic,” Federal Reserve Bank of New York Liberty Street Economics, August 6, 2020, https://libertystreeteconomics.newyorkfed.org/2020/08/a-monthly-peek-into-americans-credit-during-the-covid-19-pandemic.html.
Disclaimer
The views expressed in this post are those of the authors and do not necessarily reflect the position of the Federal Reserve Bank of New York or the Federal Reserve System. Any errors or omissions are the responsibility of the authors.


 RSS Feed
 Follow Liberty Street Economics
Great your explanation. Anyone can understand your content.