At the end of March, we launched the Weekly Economic Index (WEI) as a tool to monitor changes in real activity during the pandemic. The rapid deterioration in economic conditions made it important to assess developments as soon as possible, rather than waiting for monthly and quarterly data to be released. In this post, we describe how the WEI has measured the effects of COVID-19. So far in 2020, the WEI has synthesized daily and weekly data to measure GDP growth remarkably well. We document this performance, and we offer some guidance on evaluating the WEI’s forecasting abilities based on 2020 data and interpreting WEI updates and revisions.
Understanding the WEI
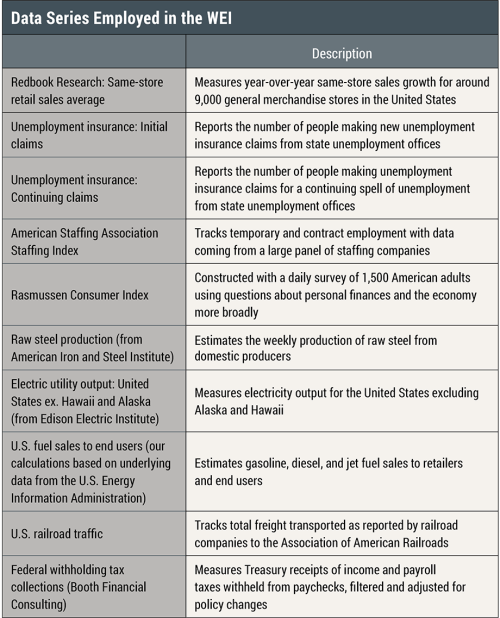
As detailed in our March post (and associated Staff Report), the WEI is the first principal component of a collection of daily and weekly series covering consumer behavior, labor market conditions, and industrial production. It is scaled to track four-quarter GDP growth, so that a reading of -5 percent means that if the given week’s conditions persisted for a full quarter, then we would, on average, expect GDP to shrink by 5 percent that quarter relative to a year prior. Since March, we have expanded the WEI to include continuing claims for unemployment insurance (UI), federal income tax withholding, and railroad traffic. The table below describes the series included. In April, we began publishing bi-weekly updates of the WEI on the New York Fed website. We recently transitioned to an interactive version of the site, allowing readers to manipulate plots of the time series to their needs.

The WEI during COVID-19
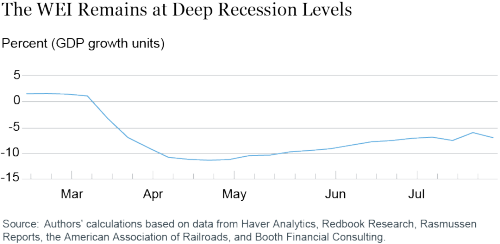
Much has happened in the U.S. economy since March. Weekly initial UI claims surpassed one million for the first time, before hitting six million by the end of the month. Continuing claims peaked at nearly twenty-three million, with many more receiving assistance through pandemic relief programs. Reflecting such unprecedented developments, the chart below shows how the WEI fell rapidly to -11.5 percent, nearly three times lower than the trough of the Great Recession (-4.0 percent). The downturn in the WEI was also driven by factors beyond the labor market, as retail sales, fuel sales, the staffing index, and tax withholding all fell further than during the Great Recession.

The WEI started to point to recovery in the week of May 2 after states began to reopen in late April. Much talk has focused on the shape of any recovery, with optimists searching for a quick return to pre-COVID levels. The WEI has so far told a more cautious story, with a modest pickup in activity for eleven consecutive weeks, through July 11.
As some states were forced to scale back reopening efforts in the wake of surging coronavirus cases, speculation began that economic conditions would reverse course, particularly owing to fears that government relief programs would expire. The WEI offered some evidence of this in the week of July 18. It remains to be seen whether that week represents an isolated blip or the beginning of a broader stall.
The WEI’s Performance in 2020
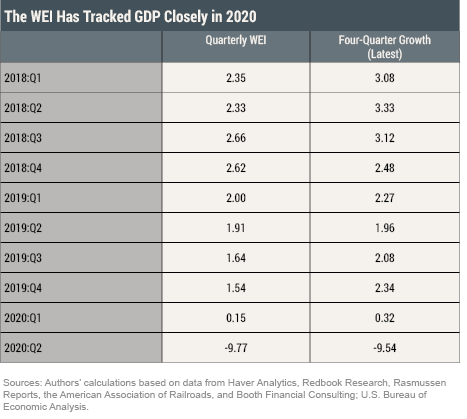
The WEI’s prediction for the four-quarter GDP growth rate is simply the average of the WEI over the weeks of the quarter. The table below reports the quarterly average WEI from 2018 to the present and the latest values of four-quarter GDP growth. In general, the WEI has anticipated four-quarter GDP growth very well. This is particularly true so far in 2020, with the predicted values for Q1 and Q2 almost spot on.
It is also possible to use WEI readings to infer growth over the previous quarter. Specifically, quarterly growth can be computed using the formula:

where WEIq is the average WEI for the quarter, ĝq is implied annualized quarterly growth, and gq-1 etc. are annualized quarterly growth in the previous three quarters. Applying this formula to the 2020 data (using the third revision values for growth in previous quarters, which were available in “real time”), the WEI has done surprisingly well. For Q1, we obtain -5.44 percent, less than 50 basis points from the latest value, -4.96 percent. For Q2, we estimate -33.10 percent, less than 20 basis points from the advance release, -32.90 percent. The formula works less well when the prior GDP values used as inputs are subject to sizable revisions.

Interpreting WEI Revisions
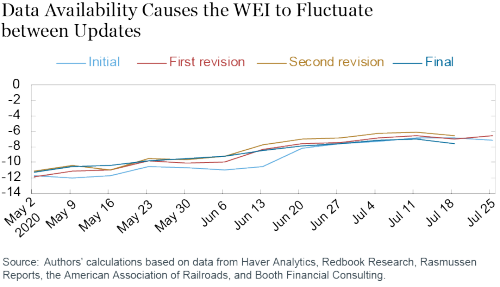
As analysts and the public alike pore over the data for evidence of recovery or renewed deterioration, it can be tempting to interpret every turn in the data as a signal of a broader trend. We endeavor to provide guidance on how to interpret the fluctuations when we post initial estimates and subsequent revisions for each week’s WEI. Essentially, the data available at different times can provide different signals about the economy. Sometimes these adjustments of the WEI give the impression of a turn in conditions, only to be subsequently revised away.
The chart below exhibits the pattern we have observed for the different WEI vintages since recovery began. For the most part, the WEI has increased from the initial estimate to the first revision, as additional data—which have tended to provide a more positive signal than the earliest releases—become available. For instance, electricity output has returned to pre-COVID levels, and fuel sales have recovered strongly. The second revision, incorporating the staffing index, has generally been upward during this period, since that series currently provides a more positive signal than other labor market series. However, that means that this update almost always overshoots, before being revised downward with the final estimate. As a further consequence, the second revision value is often higher than the initial estimate for the following week (released on the same day), potentially creating the false impression of a reversal. As we emphasize regularly in the commentary provided with the updates, it is best to refrain from scrutinizing fluctuations from one week to the next until at least the first revision on Thursday, or ideally, until the WEI is finalized the following Thursday. Alternatively, initial estimates (or second revisions, etc.) provide a better interim comparison from one week to the next, since they include the same set of data releases.

The WEI has provided a timely signal of shifting economic conditions as the U.S. economy has undergone an unprecedented period of contraction. A caveat is that the performance may turn out to be less impressive with GDP revisions. Still, the WEI is a useful tool to assess the economy’s progress as policymakers evaluate the timing and size of the recovery.
 Daniel Lewis is an economist in the Federal Reserve Bank of New York’s Research and Statistics Group.
 Karel Mertens is a senior economic policy advisor at the Federal Reserve Bank of Dallas.
James Stock is the Harold Hitchings Burbank Professor of Political Economy, Faculty of Arts and Sciences of Harvard University and member of the faculty at the Harvard Kennedy School.
How to cite this post:
Daniel Lewis, Karel Mertens, and James Stock, “Tracking the COVID-19 Economy with the Weekly Economic Index (WEI),” Federal Reserve Bank of New York Liberty Street Economics, August 4, 2020, https://libertystreeteconomics.newyorkfed.org/2020/08/tracking-the-covid-19-economy-with-the-weekly-economic-index-wei.html.
Disclaimer
The views expressed in this post are those of the author and do not necessarily reflect the position of the Federal Reserve Bank of New York or the Federal Reserve System. Any errors or omissions are the responsibility of the author.


 RSS Feed
 Follow Liberty Street Economics