In this post we analyze consumer beliefs about the duration of the economic impact of the pandemic and present new evidence on their expected spending, income, debt delinquency, and employment outcomes, conditional on different scenarios for the future path of the pandemic. We find that between June and August respondents to the New York Fed Survey of Consumer Expectations (SCE) have grown less optimistic about the pandemic’s economic consequences ending in the near future and also about the likelihood of feeling comfortable in crowded places within the next three months. Although labor market expectations of respondents differ considerably across fairly extreme scenarios for the evolution of the COVID pandemic, the difference in other economic outcomes across scenarios appear relatively moderate on average. There is, however, substantial heterogeneity in these economic outcomes and some vulnerable groups (for example, lower income, non-white) appear considerably more exposed to the evolution of the pandemic.
Measuring Consumer Expectations
The COVID pandemic, dubbed “The Uncertainty Pandemic” by Harvard economist Kenneth Rogoff, has been accompanied by high and pervasive uncertainty about the future path of the virus and the response to it by policymakers, households, and firms. Here we assess consumers’ views about the future course of the pandemic and about its impact on future household economic decisions and outcomes, drawing on the SCE. Since June 2013 the SCE collects information on the economic expectations and behavior of households.
The SCE is designed to be a nationally representative, internet-based survey of about 1,300 U.S. households. In addition to the monthly core questionnaire, special surveys are fielded at regular frequencies on various topics and are occasionally fielded on an ad-hoc basis to answer policy relevant questions in a timely manner. The analysis in this post is based on data collected as part of two special surveys on the pandemic fielded in June (between June 10-June 30) and August (between August 6‑August 21).
Expectations Regarding the Duration of the Pandemic’s Economic Impact
We start with consumers’ beliefs regarding the expected number of weeks it will take for U.S. economic activity to get back to pre-COVID levels. When asked in June, the average expected number of weeks required for economic recovery was 94 weeks. This average increased to 132 weeks (more than 2 years) in August. Even though there are differences in the expectations of respondents, the increase since June in the expected duration of the economic recovery is similar across demographic groups.
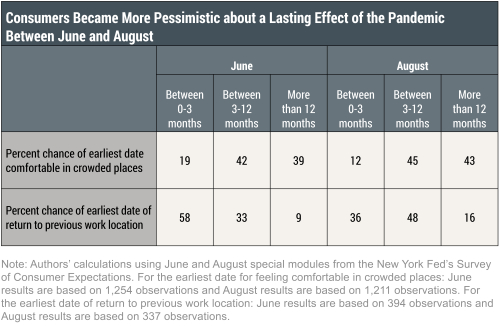
Based on the August survey, 32 percent of the respondents in our sample work from home due to the pandemic. This share rises as high as 40 percent for respondents younger than age 40, and 50 percent for respondents with a college degree or with household incomes over $75,000. When asked about their expectations of the earliest date of a return to their previous work location, employed respondents on average report a 36 percent chance for a return within the next three months, 48 percent for returning between three to twelve months, and a 16 percent chance for returning to the office in more than a year, as indicated in the table below. When compared to the June results, we observe a significant deterioration in expectations of going back to the office in less than 3 months (58 percent chance in June versus 36 percent chance in August).
The June and August surveys also elicit information on whether respondents feel comfortable going to crowded places such as movie theaters, concerts, and airports. In both waves, we observe only around 23 percent of respondents reporting currently feeling comfortable going to such crowded places. As expected, this share goes down for older respondents (14 percent for age 60+). Moreover, when we ask when they think they will start feeling comfortable, respondents in the August survey report an average 45 percent chance for feeling comfortable sometime in the next three to twelve months and 43 percent chance of feeling comfortable in more than twelve months. As indicated in the table below, this reflects a considerable deterioration in the expected chance of feeling comfortable in crowded places within the next three months from June to August (19 percent chance in June versus 12 percent chance in August). Except for younger respondents being significantly more optimistic, these expectations are comparable across race, education, income, homeownership and Census region.

Summing up, our results show that most respondents do not see a quick recovery from the pandemic and have grown less optimistic since June about the pandemic’s economic consequences ending in the near future and about the likelihood of feeling comfortable in crowded places within the next three months.
Hypothetical Scenarios
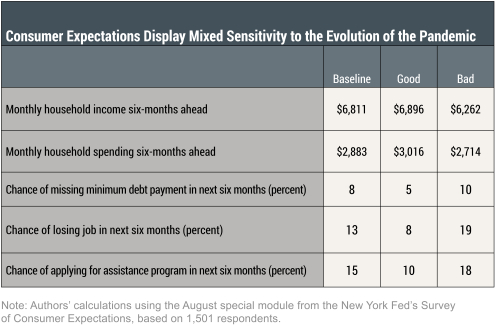
How sensitive do consumers expect their future spending, income, and debt repayment to be to the evolution of the pandemic? To address this question, we took an experimental approach as part of the special SCE survey fielded in August 2020. The basic idea is to test how spending, income, and debt repayment expectations respond to different scenarios for the path of the pandemic. Each SCE respondent was asked to consider three hypothetical scenarios for the possible evolution of the COVID pandemic in the United States over the next six months. Under the “baseline” scenario, the levels of new coronavirus cases, deaths, and restrictions on distancing in the United States (including where the respondent currently lives) all remain exactly the same as they currently are today. The coronavirus cases, deaths, and restrictions on distancing all gradually drop to zero over the next six months in the “good” scenario, whereas they double in the “bad” scenario. For each scenario, we ask the respondents what they think would happen to their monthly household spending, income, their ability to make necessary payments, their employment prospects, and chances of applying for government assistance over the next six months.
As indicated in the table below, respondents expect their monthly spending to be $2,883 on average under the baseline scenario. They expect their spending to increase by 4.6 percent to $3,016 under the good scenario and to decrease by 5.9 percent to $2,714 under the bad scenario. Note that, if taken at face value, the 5.9 percent decrease in spending in the bad scenario (in which COVID cases doubled) can be interpreted as a -6 basis point “COVID elasticity of spending.” That is an increase of 1 percent in COVID-19 cases and deaths results in a 0.06 percentage decrease in household spending. In both scenarios, the dollar and percentage change in spending is larger for high income respondents and for those with a college degree.
As indicated in the table below, respondents on average expect their monthly household income to be $6,811 under the baseline scenario. Respondents only expect a modest increase in their household income of 1.2 percent to $6,896 under the good scenario, and a decrease of 8.1 percent to $6,262 under the bad scenario. In both scenarios, the dollar and percentage change in income is again larger for higher income respondents.
Under the baseline scenario respondents assign an 8 percent chance of missing a minimum debt or rent payment over the next six months, as compared to 5 percent and 10 percent under the good and the bad scenarios, respectively. These differences can be considered fairly modest and lower than one may have expected, especially considering the fairly extreme events the hypothetical scenarios capture. Compared to the baseline scenario, most of the changes in delinquency expectations in the good and bad scenarios are driven by lower income respondents, those under the age of 40, respondents without a college degree, and respondents who experienced a decline in income since the start of the pandemic.
The respondents who are currently employed believe that on average there is a 13 percent chance they may lose their job over the next six months—under the baseline scenario in which levels of new coronavirus cases, deaths, and restrictions on distancing remain the same as they were at the time of the August survey. In contrast, the average probability to lose one’s job is 8 percent in the good scenario and jumps to 19 percent under the bad scenario. Compared to the baseline scenario, most of the differences in expectations in the good and bad scenarios are driven by respondents in the bottom tercile of income.

Finally, in the baseline scenario, respondents evaluate the chance that they will apply for an assistance program (such as, food stamps, income assistance, rent or mortgage or other debt repayment assistance programs) over the next six months to be 15 percent on average. The average chance of applying to an assistance program drops to 10 percent in the good scenario and increases to 18 percent in the bad scenario. Compared to the baseline scenario, most of the changes in the good and bad scenarios are driven by respondents in the bottom tercile of income, those below the age of 45, and respondents who self-identify as non-white. In particular, non-white respondents believe there is 29 percent chance that they will apply for an assistance program under the bad scenario. The relatively high likelihood of applying to assistance programs in the different scenarios may contribute to explaining the comparatively low expected delinquency rate sensitivity discussed above.
To sum up, our analysis reveals the importance of both the evolution of the pandemic as well as the continuation of government support programs for household expectations. Labor market expectations appear rather sensitive to the evolution of the pandemic. While our scenarios present fairly extreme differences in the evolution of the COVID pandemic, respondents report moderate responsiveness of their income and spending expectations to the course of the pandemic, and a relatively muted sensitivity for delinquency expectations, which have remained reasonably low and stable throughout the pandemic. There is, however, substantial heterogeneity and some vulnerable groups (for example, lower income, non-white) appear considerably more exposed to the evolution of the pandemic.
The relative insensitivity of delinquency expectations, together with a large sensitivity of expected application rates to government assistance programs, suggest that the forbearance and other assistance programs currently in place have been effective in supporting household financial conditions during the pandemic. It also suggests that their continuation likely would mitigate delinquencies over the coming months.

Olivier Armantier is an assistant vice president in the Federal Reserve Bank of New York’s Research and Statistics Group.

Leo Goldman is a senior research analyst in the Bank’s Research and Statistics Group.

Gizem Koşar is an economist in the Bank’s Research and Statistics Group.
Jessica Lu is a senior research analyst in the Bank’s Research and Statistics Group.

Rachel Pomerantz is a senior research analyst in the Bank’s Research and Statistics Group.

Wilbert van der Klaauw is a senior vice president in the Bank’s Research and Statistics Group.
How to cite this post:
Olivier Armantier, Leo Goldman, Gizem Koşar, Jessica Lu, Rachel Pomerantz, and Wilbert van der Klaauw, “How Do Consumers Believe the Pandemic Will Affect the Economy and Their Households?,” Federal Reserve Bank of New York Liberty Street Economics, October 16, 2020, https://libertystreeteconomics.newyorkfed.org/2020/10/how-do-consumers-believe-the-pandemic-will-affect-the-economy-and-their-households.html.
Disclaimer
The views expressed in this post are those of the authors and do not necessarily reflect the position of the Federal Reserve Bank of New York or the Federal Reserve System. Any errors or omissions are the responsibility of the authors.


 RSS Feed
 Follow Liberty Street Economics