American companies have raised almost $1 trillion in the U.S. corporate bond market since March. If companies had been unable to refinance those bonds, their inability to repay may have led to an immediate default on all of their obligations, creating a cascade of defaults and layoffs. Based on Compustat data, an inability to access public bond markets could have affected companies employing more than 16 million people. In this post, we document the impact of the Primary Market and Secondary Market Corporate Credit Facilities (PMCCF and SMCCF) on bond market functioning, summarizing a detailed evaluation described in a new working paper. We also describe the impact that a collapse of corporate bond markets could have had on employment and investment.
What has the direct impact of the facilities been?
The direct impact of the facilities was to improve bond market functioning, reduce default probabilities and reverse some of the dramatic increase in bond spreads prior to March 2020. We document a dramatic reduction in average duration-matched spreads—that is, spreads to Treasuries with similar timing of interest and principal payments—of 140 basis points in the three months after the initial announcement of the facilities. Lower spreads in the secondary market often translate into lower interest rates on newly issued bonds, facilitating companies’ access to debt markets.
We estimate that a third of the spread improvement occurred on March 23, the initial announcement date of the facilities. Another third occurred between March 23 and April 9 when the facility term sheet was revised and additional information provided. The last third was experienced after the commencement of facility purchases on May 12. Decreases in market expectations of default within one year were smaller, suggesting a significant role for improved attitudes toward risk.
Bid-ask spreads are a commonly used measure of market functioning, with bonds with higher bid-ask spreads typically trading at lower prices. We measure bid-ask spreads as the difference between the prices at which a dealer sells to and buys from customers. The average bid-ask spread decreased by about 200 basis points between March 20 and June 26 (the end of our sample). Similar to credit spreads, almost half of this improvement occurred on March 23, and another 60 bps by April 9. Bid-ask spreads on bonds bought directly by the facility improved 2.5 bps per million dollars of cash bond purchases—an additional 5 percent over the baseline improvement—while SMCCF purchases of bond exchange traded funds (ETFs) did not result in a discernible improvement in bid-ask spreads.
Did the CCFs affect companies’ ability to fund operations?
A lack of market liquidity may deter investors from funding companies. Improvements in secondary market conditions pass-through to the primary market directly, as primary market prices are benchmarked to secondary market prices of similar bonds and, indirectly, by increasing the willingness of dealers to underwrite bond issuance. We find an immediate improvement in primary market issuance and pricing after the announcement of the corporate credit facilities (CCFs), particularly for issuers eligible for the facility. By the end of June, investment-grade issuers had issued more than $702 billion of senior unsecured and secured bonds, nearly double the amount issued by the same point in 2019. It is important to note, however, that the existence of the facility did not distort issuance decisions since bonds were not issued to target SMCCF eligibility regarding bond maturity. Further, the ability of bond prices to accurately reflect the relative riskiness of different bonds was not distorted.
Market functioning improved most for eligible bonds
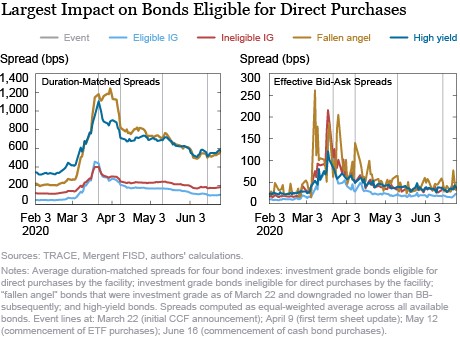
In order to understand the channels through which the CCFs affect bond markets, we estimate their relative impact on eligible and non-eligible securities. The approach is illustrated by the four bond “indexes” shown in the chart below: investment grade bonds eligible for direct purchases by the facility; investment grade bonds ineligible for direct purchases by the facility; “fallen angel” bonds that were investment grade as of March 22 and downgraded to no lower than BB- subsequently; and high-yield rated bonds. Note that almost all bonds of U.S. companies that mature before 2025 are eligible for the CCFs and included in the SMCCF broad market index, with the exception of banks.
The left panel of the chart below shows duration-matched spreads while the right panel shows bid-ask spreads. Comparing changes across the four indexes, the biggest improvements in spreads occurred for bonds eligible for direct purchases by the facility, with improvements accelerating around the commencement of cash bond purchases on June 16. Thus, though market conditions improved for all traded bonds, they were greatest for bonds eligible for direct purchases by the facility and, in particular, for bonds bought in greater volumes by the facility. These differential improvements are most pronounced for credit spreads.
The chart below also shows that, as issuers became eligible for purchases by the facility, conditions for those issuers began to improve. In particular, spreads on “fallen angel” bonds—those that were rated investment grade as of March 22 but were subsequently downgraded to no lower than BB- or equivalent. These spreads rose more than those of other investment grade bonds ahead of the March 22 announcement, but only started attenuating around the April 9 term sheet update, which specified that fallen angel issuers would be eligible for direct purchases by the facilities.

Why is improving bond market access important?
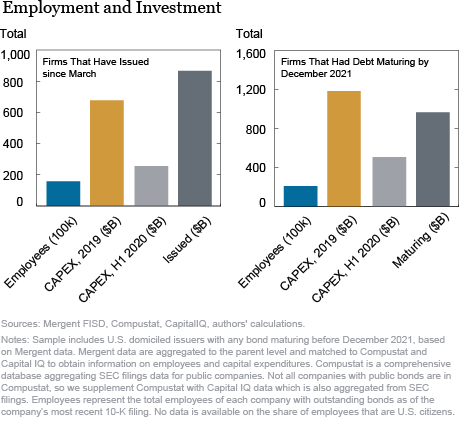
Of the U.S. domiciled companies in Compustat, 358 companies had bonds that were due to mature in 2020 or 2021, representing approximately 70 percent of employees and capital expenditures of all Compustat firms. If companies were unable to refinance those bonds, their inability to repay may have led to an immediate default on all of their obligations, creating a cascade of defaults throughout their supply chain. These effects would likely be large—academic estimates of the deadweight losses from bankruptcies are about 10 percent of company value. Since corporate debt typically has cross-default provisions, a total of $2.2 trillion in public bond claims could have entered bankruptcy if those maturing bonds triggered defaults. As shown in the chart below, these companies employed more than 21 million people and spent more than $1.1 trillion on capital expenditures in 2019.
How many jobs would be at risk in the event of widespread defaults? Companies in industries unaffected by the pandemic might have been able to access debt markets eventually without Federal Reserve intervention, although likely at disrupted prices. If only companies in affected industries defaulted on their debt, more than 10 million employees working in these companies would be at risk. In the financial crisis, Hortaçsu and co-authors estimate that when GM was at risk of defaulting it reduced demand for new GM cars and the price of used GM cars. Almeida and Philippon estimate the cost of financial distress for BBB-rated issuers at 4.5 percent of firm value – which is far less than 100 percent, as the US historically has an efficient bankruptcy system to reorganize solvent companies.

Corporate bonds don’t just fund companies, they fund retirement
An additional benefit of the corporate credit facilities is that, by preventing potential widespread defaults, the facilities may have avoided shocks to the cash flows of American workers saving for retirement. Indeed, the majority (60 percent) of U.S. corporate bonds are owned by U.S. residents, according to Treasury International Capital System data. These holdings are held both indirectly, through life insurance or mutual funds, as well as directly by households and pension funds, with fixed income approximately 20 percent of public pension assets.
 Nina Boyarchenko is an officer in the Federal Reserve Bank of New York’s Research and Statistics Group.
 Anna Kovner is a policy leader for financial stability in the Bank’s Research and Statistics Group.
 Or Shachar is an economist in the Bank’s Research and Statistics Group.
How to cite this post:
Nina Boyarchenko, Anna Kovner, and Or Shachar, “The Impact of the Corporate Credit Facilities,” Federal Reserve Bank of New York Liberty Street Economics, October 1, 2020, https://libertystreeteconomics.newyorkfed.org/2020/10/the-impact-of-the-corporate-credit-facilities.html.
Additional Resources
Primary Market Corporate Credit Facility
Secondary Market Corporate Credit Facility
Disclaimer
The views expressed in this post are those of the authors and do not necessarily reflect the position of the Federal Reserve Bank of New York or the Federal Reserve System. Any errors or omissions are the responsibility of the authors.


 RSS Feed
 Follow Liberty Street Economics
Hi Ed, Thanks for your comment. As you say, the blog post focuses on the impact on the bond market as well as the counterfactual impact on employment and investment if this market were to become dysfunctional. As we discuss in more detail in the paper, though the primary effect of the facilities announcement was to reduce the corporate bond default risk premium, default probabilities also declined upon the introduction of the facilities. The equilibrium implications are worth considering. To the extent that these interventions encourage dealers to resume intermediation of corporate bonds, the expectation of intervention should be a net positive. On the contrary, in order to conclude that the facilities contribute to a debt bubble, you would have to find evidence that the facilities are distorting prices and issuance decisions significantly. By pricing the PMCCF at a market price plus a penalty rate, and by buying a market index, the facility design attempts to limit those distortions. Even the “fallen angel” segment, which conceivably could benefit most from market access, has issued bonds at market prices in the public debt markets, without accessing the facility. Furthermore, we haven’t seen firms changing bond characteristics — for example, by shifting issuance to below 5 year maturity — to specifically target facility eligibility.
You certainly very well covered the positive, and unexpectedly, wildly successful impact of the Fed’s early and unprecedented actions taken in March. Some of your data and arguments are very helpful to understand just how successful it has been — for now. But what you did not cover adequately is the possible “unintended consequences” of their actions. Namely, the motivation of a “Risk-On” scenario for investors and firms. And,has it contributed to an already over-levered situation of corporate America, ie. a debt “bubble”? Today’s WSJ on that proposition echoes what I have been lecturing and debating with others on over the past few months. Thank you for your efforts. Ed Altman, NYU Stern