When the U.S. Treasury sells a new security, the security is announced to the public, auctioned a number of days later, and then issued sometime after that. When-issued (WI) trading refers to trading of the new security after the announcement but before issuance. Such trading promotes price discovery, which may reduce uncertainty at auction, potentially lowering government borrowing costs. Despite the importance of WI trading, and the advent of Treasury trading volume statistics from the Financial Industry Regulatory Authority (FINRA), little is known publicly about the level of WI activity. In this post, we address this gap by analyzing WI transactions recorded in FINRA’s Trade Reporting and Compliance Engine (TRACE) database.
When-Issued Nomenclature
The time span over which securities trade when issued covers two distinct periods. In the first period, from the announcement through the auction day, securities are WI and called as such. In the second period, from the day following the auction to the day preceding issuance, securities are WI and on-the-run, but are typically just called on-the-run, reflecting the market convention for securities to become on-the-run as of the day following auctions. Our analysis considers securities to be WI over both intervals, but recognizes the distinction between the two by assessing volumes separately for each case.
FINRA Treasury Aggregate Statistics
In March 2020, FINRA started reporting weekly, aggregate data on the trading volume of Treasury securities reported to TRACE. Such statistics exclude trades executed prior to and including the auction day—before securities trade on-the-run—but include trades from the day after auction. That is, the FINRA statistics exclude WI trades of securities that are not on-the-run, but include WI trades of securities that are on-the-run.
When-Issued Trading Volume
Based on Treasury TRACE transactions data, WI trading volume averaged $80 billion per day between July 1, 2019, and June 30, 2020, accounting for 12 percent of the $651 billion traded daily across all Treasury securities. When we disaggregate WI trading volume by security type in the table below, we find that nominal coupon securities account for the vast majority (65 percent) of WI trading, averaging $52 billion per day over all trading days in the sample period, and $69 billion per day over the subset of days that coupon securities were eligible to trade when issued. Bills also account for a sizeable share (34 percent) of WI trading, averaging $28 billion per day. Treasury Inflation-Protected Securities (TIPS) and floating rate notes (FRNs) account for the remaining small share of WI trading (1 percent).
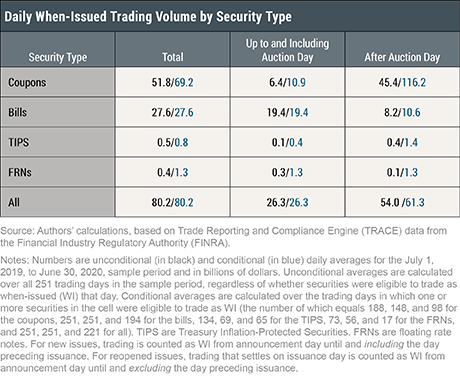
The table also distinguishes between WI trading that occurs up to and including the auction day (accounting for about one-third of WI trading) and WI trading that occurs after the auction day (accounting for about two-thirds of WI trading). Coupon securities and TIPS in particular, have much greater WI trading after auctions. In contrast, bills, and to a certain extent FRNs, exhibit greater WI trading before auctions.
Trading Volume by Venue
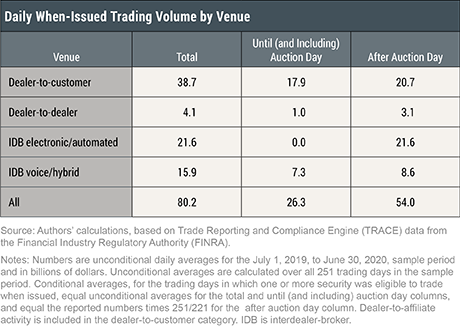
When we disaggregate WI trading by venue in the next table, we find that the dealer-to-customer and the interdealer-broker (IDB) segments account for about 48 percent and 47 percent of WI activity, respectively, with the dealer-to-dealer segment accounting for 5 percent. This breakdown is similar to that for overall trading activity, reported in this post. Moreover, like that earlier work, we find that most IDB activity occurs through electronic/automated platforms, with the remainder through voice/hybrid brokers. In addition, we find that the electronic/automated IDB activity occurs entirely in on-the-run coupon securities, consistent with the evidence in this other post, so the only WI trading on those platforms occurs after auction day.
Trading Volume over Time
A plot of daily WI activity over the sample period reveals high variation as shown below, with volume ranging from about $3 billion on November 20, 2019, to $534 billion on February 28, 2020. The February 28 peak occurred amidst concerns about the pandemic and record high trading volumes in the market overall, as shown in this post. The chart also illustrates a cyclical pattern of WI activity, partly reflecting the periodicity of Treasury coupon security auctions.
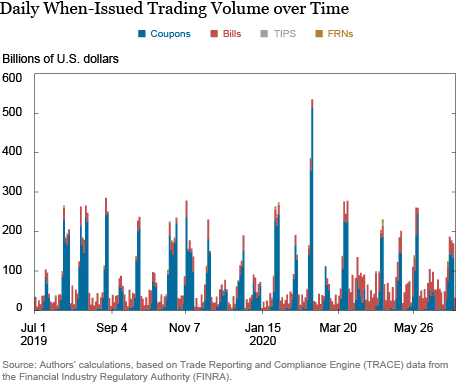
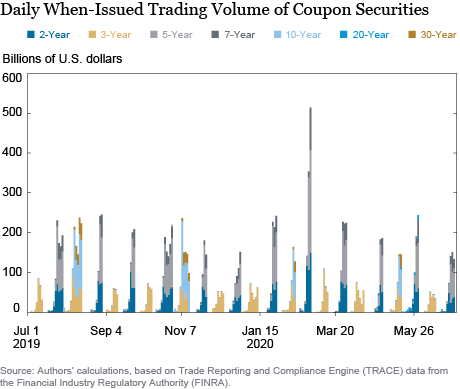
The next chart zeroes in on the coupon securities and shows that the spikes in activity late in each month are attributable to the monthly auctions of the 2-, 5-, and 7-year notes. The February 28, 2020, peak thus occurred not only amidst record trading volume overall, but when the 2-, 5-, and 7-year notes were all both WI and on-the-run. In contrast, the spikes in activity just before the middle of each quarter are associated with the quarterly refunding auctions of new 3-, 10-, and 30-year securities. New 3-year notes are also issued during the middle of the other months of the year. Additional amounts of outstanding 10- and 30-year securities are also sold in those other months, but such reopenings are associated with lower WI activity (market participants can instead trade the outstanding securities, which are on-the-run, for next-day settlement in such cases).
Trading Volume over the When-Issued Cycle
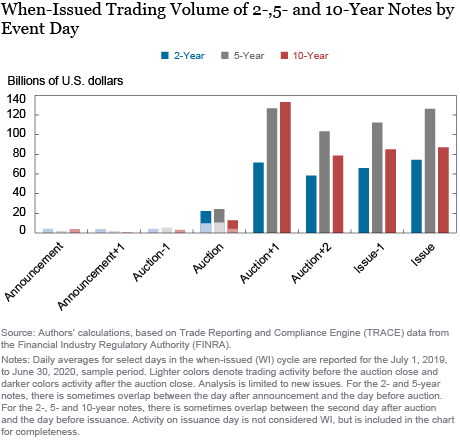
We last consider how trading volume evolves over the WI cycle. The next chart plots average WI trading volume on the announcement day, auction day, issuance day, and select adjacent days for the 2-, 5- and 10-year notes (new issues only, no reopenings). Regardless of security, activity is relatively low before auction, increases notably on the auction day, and then increases sharply again the day following auction, when the securities become on-the-run. The levels of activity after auction day are broadly consistent with the average on-the-run levels of activity, reported in this post. Of the activity on auction day, somewhat less than half occurs before the auction closing time.
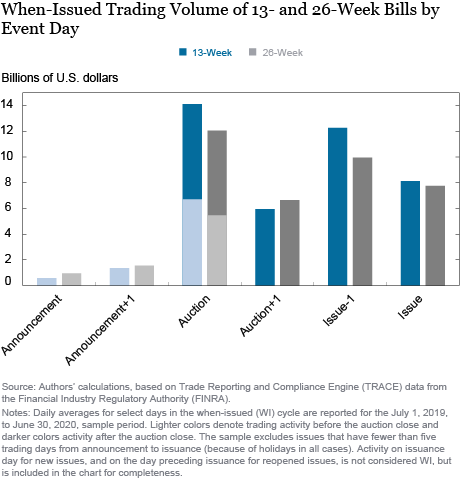
The last chart plots average WI trading volume on the announcement day, auction day, issuance day, and select adjacent days for the 13- and 26-week bills. The pattern here is somewhat different, with activity jumping on auction day to a level commensurate with, if not greater, than that seen on subsequent days (when the bills are on-the-run). Using older data from the interdealer market, this paper in the Journal of Money, Credit, and Banking (released earlier as a New York Fed staff report) also found activity on auction day to be similar to activity over the period the bills are on-the-run.
Summing Up
Our analysis identifies a number of differences in WI trading activity across securities and over time. WI activity is concentrated in coupons and bills, with much less WI trading of TIPS and FRNs. Moreover, WI activity exhibits cyclicality that is driven by monthly and quarterly auction patterns. Over the WI cycle, most trading for coupon securities occurs after the auction date, whereas trading for bills reaches on-the-run levels on the auction date. While this post is focused on WI trading activity, it will be interesting to explore the relationship between trading and price discovery in future work.

Michael J. Fleming is a vice president in the Federal Reserve Bank of New York’s Research and Statistics Group.

Or Shachar is a senior economist in the Bank’s Research and Statistics Group.

Peter Van Tassel is an economist in the Bank’s Research and Statistics Group.
How to cite this post:
Michael Fleming, Or Shachar, and Peter Van Tassel, “Treasury Market When-Issued Trading Activity,” Federal Reserve Bank of New York Liberty Street Economics, November 30, 2020, https://libertystreeteconomics.newyorkfed.org/2020/11/treasury-market-when-issued-trading-activity.html.
Disclaimer
The views expressed in this post are those of the authors and do not necessarily reflect the position of the Federal Reserve Bank of New York or the Federal Reserve System. Any errors or omissions are the responsibility of the authors.


 RSS Feed
 Follow Liberty Street Economics