Our previous work documents that low-income and majority-minority areas were considerably more affected by COVID-19, as captured by markedly higher case and death rates. In a four-part series starting with this post, we seek to understand the reasons behind these income and racial disparities. Do disparities in health status translate into disparities in COVID-19 intensity? Does the health system play a role through health insurance and hospital capacity? Can disparities in COVID-19 intensity be explained by high-density, crowded environments? Does social distancing, pollution, or the age composition of the county matter? Does the prevalence of essential service jobs make a difference? This post will focus on the first two questions. The next three posts in this series will focus on the remaining questions. The posts will follow a similar structure. In each post, we will aim to understand whether the factors considered in that post affect overall COVID-19 intensity, whether the racial and income gaps can be further explained when we additionally include the factors in consideration in that post, and whether and to what extent the factors under consideration in that post independently affect racial and income gaps in COVID-19 intensity (without controlling for the factors considered in the other posts in this series).
Data and Definitions
Since our COVID-19 data are available at the county level, we use data on race and income composition at the county level to differentiate between low-income and other counties, and majority-minority (MM) and other counties (see earlier Liberty Street Economics post for details about these data). We define low-income counties as those that fall in the lowest quartile of the population-weighted distribution of median household income. We define MM counties as those in which at least half the population is Hispanic and/or non-Hispanic Black.
In this post, we additionally leverage pre-COVID county-level data on comorbidities, health insurance and hospital beds. Our data on comorbidities include data on obesity, hypertension, diabetes, heart disease, cancer and respiratory diseases. We use two measures from the supply side of the health market—total number of beds and number of ICU beds—to construct a county-level measure of hospital capacity in the immediate pre-COVID period: share of hospital beds that are in the ICU. Throughout this series, we capture COVID-19 intensity by case rates as of December 15. Results for death rates are qualitatively similar and are not reported here.
The CDC advises that individuals with comorbidities are at increased risk of severe complications of COVID-19. Uninsured individuals have worse self-reported health and may be more vulnerable to COVID-19. In addition, lack of insurance limits access to health care and other hospital facilities, and can increase exposure and vulnerability to this disease. Finally, ICU resources are essential for treating severe cases of COVID-19. Timely access to ICU services and medical facilities can reduce death rates. Better treatment and cures due to access to health resources can also control the spread of the disease and hence reduce case rates. At issue is whether the incidence of comorbidities and access to health insurance and health resources vary along income and racial lines. If they do, they could potentially affect some of the racial and income disparities we see in the data.
Health Factors and COVID-19 Race and Income Gap
For existing comorbidities, access to health facilities and health insurance to affect racial and income disparities, they should be correlated with low-income and MM status. Looking at the correlations, we find that both low-income and MM counties are also counties that have higher uninsurance rates, a lower share of hospital resources in the ICU (for low-income counties, but not MM counties) and a higher rate of comorbidities. An important question then is whether the higher exposures to COVID-19 in MM and low-income counties are partly explained by some of these health factors.
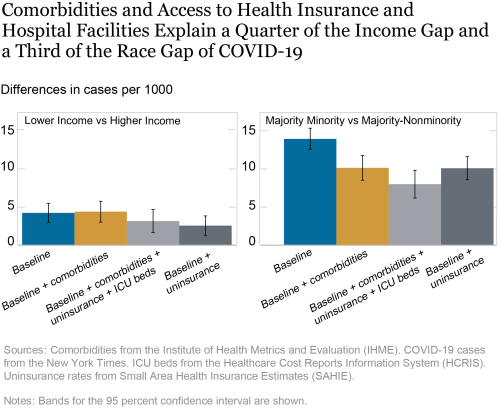
To better understand the role of these various health factors in explaining the racial and income gap of COVID-19 incidence we use a multivariate regression analysis. All regressions control for time-invariant characteristics of the states and exploit within-state across-county variation to understand patterns. For better comprehensibility, throughout this series, we will present the regression coefficients of interest as bar charts, as shown below. The left-hand panel shows the differences in cases per 1,000 for low-income counties compared to others (the income gap), while the right-hand panel shows the differences for MM counties compared to others (the minority gap). The baseline bars in blue show that low-income counties have 4.2 more cases per 1,000 people than other counties and MM counties have 14 more cases per 1,000 people than other counties after controlling for population density and urban status. We define counties that fall within a metropolitan statistical area (MSA) as urban counties.
Building on the baseline bars for both panels, the second bars in gold account for differences in comorbidities between counties. Comparing the first and second bars in the right panel, we find that inclusion of comorbidities reduces the minority gap by more than a quarter, while the left panel shows that the income gap remains similar. These imply that differences in prevalence of comorbidities in MM versus other counties are associated with differences in COVID-19 case rates in these counties.
In each panel, the third bar in light gray includes additional health variables: health insurance and share of ICU beds (as a proportion of all hospital beds) in a county. Comparing the minority and income gaps between the light gray bars and the gold bars we find that the inclusion of these health variables leads to a decline in both gaps. The income gap falls a quarter of its value and the minority gap shrinks to less than two-thirds. Thus, in addition to the role of comorbidities (the gold bars), the results in the light gray bars suggest that some of the racial and income inequalities in COVID-19 exposures (the blue bars) are contributed by inequalities in other health factors, such as, ICU bed availability, and access to health insurance.
Separately, we also estimate regressions where we add the uninsurance rate and proportion of ICU beds individually and then taken together, but without adding comorbidities, to the baseline regressions. The fourth bars in both panels, in dark gray, show results when we include uninsurance rates to our baseline specification (without controlling for comorbidities or share of ICU beds). We find the inclusion of uninsurance reduces the minority gap by close to a quarter and the income gap by more than a third (compared to the baseline). In results not reported, we find a very similar reduction in the gaps when both uninsurance rates and proportion of ICU beds are added together to the baseline specification, but only a small bridging of the gaps when only the proportion of ICU beds is added. Therefore, both comorbidities and access to health insurance separately explain important components of the greater COVID-19 intensity in low-income and MM counties.

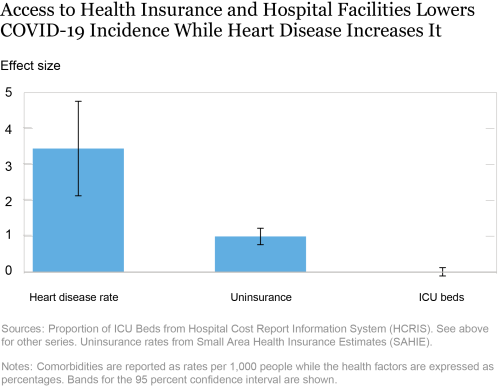
Looking more closely at the regression results that include baseline variables, comorbidities and the health variables (results corresponding to the light gray bars), we find that obesity, heart disease, hypertension and diabetes, and lack of health insurance are associated with higher COVID-19 incidence, controlling for the low-income and MM variables. In the chart below we depict the partial associations with heart disease rate, uninsurance rates and share of beds in ICU (the coefficients on all comorbidities are not shown to save space). We find that a one percentage point increase in the heart disease rate per 1,000 people in a county is associated with 3.44 more COVID cases per 1,000. A one percentage point increase in a county’s uninsurance rate is associated with 0.99 more cases per 1,000 people in a county. The increase associated with a greater fraction of beds in the ICU is not statistically distinguishable from zero.

Conclusion
This post takes a deep dive to understand the disparities in COVID-19 case rates by race and income. We find that a quarter of the income gap and more than a third of the racial gap in case rates are contributed by health status and system factors. These results suggest that policy can play a role in reducing the disparities in COVID-19 incidence. Increased access to health insurance and greater effort by public health professionals to battle chronic diseases may play an important role in reducing the impact of COVID-19 and bridging the income and racial gap of COVID-19 intensity. In our next post, we will look at the role of crowding and whether it can explain more of the gap in COVID-19 occurrence.
Ruchi Avtar is a senior research analyst in the Federal Reserve Bank of New York’s Research and Statistics Group.

Rajashri Chakrabarti is a senior economist in the Bank’s Research and Statistics Group.

Maxim Pinkovskiy is a senior economist in the Bank’s Research and Statistics Group.
How to cite this post:
Ruchi Avtar,
Rajashri Chakrabarti, and
Maxim Pinkovskiy, “Understanding the Racial and Income Gap in Covid-19: Health Insurance, Comorbidities, and Medical Facilities,” Federal Reserve Bank of New York Liberty Street Economics, January 12, 2021, https://libertystreeteconomics.newyorkfed.org/2021/01/understanding-the-racial-and-income-gap-in-covid-19-health-insurance-comorbidities-and-medical-facil.html.
Additional heterogeneity posts on Liberty Street Economics
Heterogeneity: A Multi-Part Research Series
Disclaimer
The views expressed in this post are those of the authors and do not necessarily reflect the position of the Federal Reserve Bank of New York or the Federal Reserve System. Any errors or omissions are the responsibility of the author.


 RSS Feed
 Follow Liberty Street Economics