This is the second post in a series that aims to understand the gap in COVID-19 intensity by race and income. In our first post, we looked at how comorbidities, uninsurance rates, and health resources may help to explain the race and income gap observed in COVID-19 intensity. We found that a quarter of the income gap and more than a third of the racial gap in case rates are explained by health status and system factors. In this post, we look at two factors related to indoor density—namely public transportation use and home crowding. Here, we will aim to understand whether these two factors affect overall COVID-19 intensity, whether the income and racial gaps of COVID-19 can be further explained when we additionally include these factors, and whether and to what extent these factors independently account for income and racial gaps in COVID-19 intensity (without controlling for the factors considered in the other posts in this series).
Background
Interpersonal interactions are a primary mechanism for spread of COVID-19, with poorly ventilated, crowded, and shared indoor environments exacerbating the spread of the virus. Many indoor interactions of this kind take place in public transit networks and in overcrowded apartments, which is why we focus our attention on these factors now.
Many researchers have cited public transportation as a possible major source of spread of COVID-19. Public transit is typically characterized by high density, low ventilation, and frequent turnover, leading to a high probability of an infected person entering and passing the virus to others. It is noteworthy that while most counties do not have public transportation networks, the central urban counties in major cities that were on the front lines of the pandemic in March 2020 are reliant on them. On the other hand, recent research has suggested that public transit is not a major source of transmission for other respiratory diseases, such as the flu. We conduct our analysis using county-level data on public transit use from the 2014-2018 five-year American Community Survey (ACS), which interviews approximately one out of twenty Americans and has reasonable sample sizes even at the county level.
The second density indicator that we consider is home crowding. When multiple individuals share the same living quarters, the possibility of spreading the infection if one member contracts the virus is very high. We measure home crowding by the number of persons per room, which we obtain at a county level from the detailed housing questionnaire of the 2014-2018 ACS.
Density and COVID-19 Race and Income Gap
For these density factors to help explain the COVID-19 racial and income gap, they should be correlated with the low-income and majority-minority (MM) status of counties. For the correlations, we find that residents in MM counties tend to use more public transit and to also have a significantly higher average number of persons per room. In contrast, low-income counties see less public transit ridership and have a lower number of persons per room. This is likely explained by low-income counties typically being relatively rural.
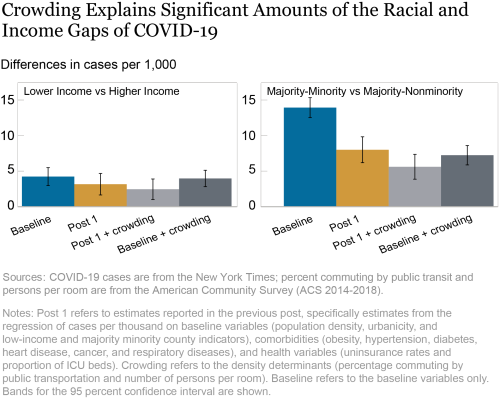
As in our previous post, we perform multivariate regression analysis to determine the extent to which density factors such as public transportation use and crowded living quarters can explain the observed racial and income gap in COVID-19 incidence and the extent to which these factors can explain overall COVID-19 intensity. The left panel of the chart below shows the difference in cases per 1,000 for low-income counties compared to others (the income gap), while the right panel shows the difference for MM counties compared to others (the minority gap). The first bars in blue in each panel show results from our original model estimated with data through December 15, where we regress cases per thousand on the baseline variables, namely population density, and indicators for urbanicity, low-income, and MM counties. The Post 1 bars in gold show the results from our previous post, where we include comorbidities and health factors in addition to baseline variables. The third set of bars, in light gray, represent the regression of cases per thousand on all the variables so far, augmented by the two density determinants discussed here. Lastly, the bars in dark gray depict the basic variables and the density determinants, but do not include the health variables introduced in the first post of this series.

Our baseline specification (which includes population density and MM, low-income, and urbanicity indicators) shows about 4.2 more cases per thousand in low-income counties, and 14 more cases per thousand for counties where minorities are in majority. When adding controls for comorbidities, uninsurance, and health resources measured by proportion of ICU beds, as depicted in the second bars in gold, we see a decrease in magnitude of these differentials (see the previous post in this series).
We next turn to the bars in light gray shown above, where we add the two mediating variables considered in this post to examine associations with COVID-19 cases. We find that the inclusion of the density factors—in addition to comorbidities, uninsurance rates, and health resources introduced in the first post in this series—further reduces the low-income and racial differentials for COVID-19 cases per thousand. The coefficient for the income gap is now less than two-thirds of the original baseline estimate, but remains statistically significant. The MM differential is still significant, at less than half of the baseline estimate.
To investigate the contributions of the density factors separately, the last bar in each panel (in dark gray) presents results from the regression of cases per 1,000 on the baseline variables (MM, low-income, urbanicity indicator, and population density) and the density indicators introduced in this post. We find that inclusion of these variables leads to a narrowing of the racial and income gaps of COVID-19 intensity. Comparing these results to the baseline results, shown in the bars in blue, we find that inclusion of public transit and persons per room reduces the MM gap from 14 cases per thousand to 7.2 per thousand, and the low-income gap from 4.2 cases per thousand to 3.9 per thousand. Thus, when considered separately, measures of crowding (as captured by persons per room and use of public transit) explain significant portions of the racial gap of COVID-19—almost half of the racial gap seen in our baseline estimates.
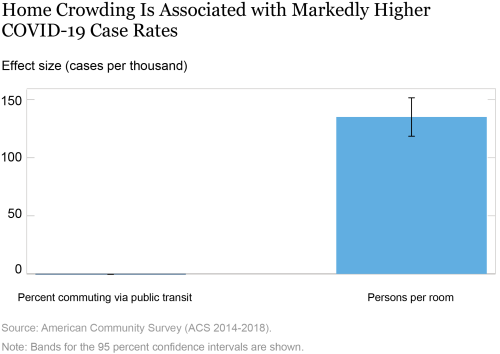
Lastly, we consider the associations between COVID-19 case rates and the density indicators, conditional on all the variables analyzed in our previous post (that is, from the multivariate regression corresponding to the light gray bars above). From the chart below, it is clear that having more persons per room is significantly associated with higher cases per thousand, where a unit increase in persons per room in a county is associated with 135 more COVID-19 cases per thousand. In results not reported, we find that this strong association between more persons per room and higher COVID-19 cases also remains when we exclude comorbidities and health variables. In contrast, the association between the percentage of persons commuting via public transit and cases per thousand is not statistically significant. However, this effect is largely driven by big cities where public transit is more common. In results not reported here where we account for this skewed distribution of the percentage commuting by public transit, we find that this variable is positively associated with COVID-19 case rates and the effect is statistically different from zero. In other words, not just home crowding, but crowding in public transit systems is also associated with higher COVID-19 incidence.

Conclusion
We conclude that density determinants like crowding play an important role in creating income and racial gaps in the incidence of COVID-19. Indeed, the combination of comorbidities, health insurance status, and density reduces the income gap by 42 percent and the racial gap by 60 percent. However, there is an unexplained portion of COVID-19 incidence that remains associated with both income and race. The analysis here and in our previous post implies that policy may play a significant role in reducing the disparities of COVID-19. For example, reducing crowding in public transportation systems, expanding health insurance coverage, battling disproportionate incidence of chronic diseases among minorities, and decreasing residential crowding may decrease the impacts of COVID-19 on low-income and minority individuals. In our next post, we will look at the role of three additional channels—namely social distancing, pollution, and demographics—to see whether they explain more of the income and racial gap in COVID-19 occurrence.
Ruchi Avtar is a senior research analyst in the Federal Reserve Bank of New York’s Research and Statistics Group.

Rajashri Chakrabarti is a senior economist in the Bank’s Research and Statistics Group.

Maxim Pinkovskiy is a senior economist in the Bank’s Research and Statistics Group.
How to cite this post:
Ruchi Avtar,
Rajashri Chakrabarti, and
Maxim Pinkovskiy, “Understanding the Racial and Income Gap in COVID-19: Public Transportation and Home Crowding,” Federal Reserve Bank of New York Liberty Street Economics, January 12, 2021, https://libertystreeteconomics.newyorkfed.org/2021/01/understanding-the-racial-and-income-gap-in-covid-19-health-insurance-comorbidities-and-medical-facil.html.
Disclaimer
The views expressed in this post are those of the author and do not necessarily reflect the position of the Federal Reserve Bank of New York or the Federal Reserve System. Any errors or omissions are the responsibility of the author.


 RSS Feed
 Follow Liberty Street Economics