Today, the New York Fed’s
Center for Microeconomic Data reported that household debt balances increased by $206 billion in the fourth quarter of 2020, marking a $414 billion increase since the end of 2019. But the COVID pandemic and ensuing recession have marked an end to the dynamics in household borrowing that have characterized the expansion since the Great Recession, which included robust growth in auto and student loans, while mortgage and credit card balances grew more slowly. As the pandemic took hold, these dynamics were altered. One shift in 2020 was a larger bump up in mortgage balances. Mortgage balances grew by $182 billion, the biggest quarterly uptick since 2007, boosted by historically high volumes of originations. Here, we take a close look at the composition of mortgage originations, which neared $1.2 trillion in the fourth quarter of 2020, the highest single-quarter volume seen since our series begins in 2000. The Quarterly Report on Household Debt and Credit and this analysis are based on the New York Fed’s Consumer Credit Panel, which is itself based on anonymized Equifax credit data.
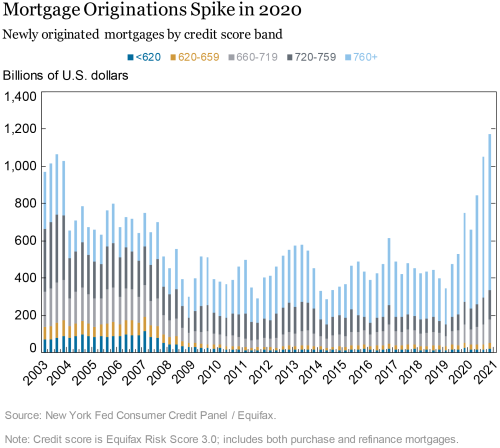
In the first chart, we look at a figure direct from the Quarterly Report: total mortgage originations by credit score band. Here, the boom in originations is starkly visible—originations to the highest credit score borrowers rose sharply during 2020. (We use the Equifax Risk Score 3.0). The origination volume in the fourth quarter of 2020 just surpassed the previous high, from 2003, when a dip in mortgage interest rates prompted a boom in mortgage refinancing. Although these two bumps in mortgage originations are similar in magnitude, the composition is quite different; 71 percent of originations in the fourth quarter of 2020 went to borrowers with credit scores over 760, while in the third quarter of 2003, only 31 percent of those new mortgages went to the most creditworthy borrowers. Researchers have concluded that the 2003 refi boom had long-running consequences, contributing to over-leveraged balance sheets as home prices fell.

Purchases or Refis?
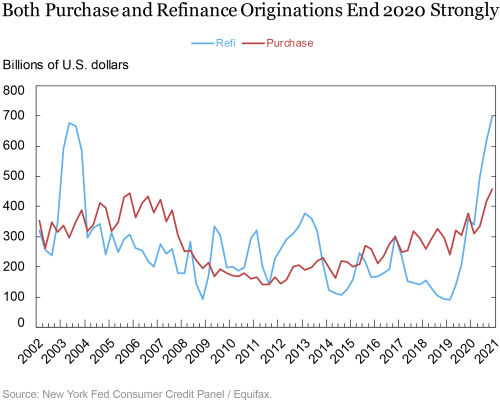
Refinances do tend to go to higher-credit-score borrowers, compared to purchase mortgages—this is because those who are refinancing already have a mortgage that they’ve been repaying for some time and are building their credit history. Thus, this high volume of superprime mortgage originations suggests we are in the midst of another refinance boom. And homeowners are taking advantage of the mortgage interest rates at historic lows, even taking some cash out with their refinanced mortgages. In the following chart, we break out mortgage originations into purchase and refinances. The origination boom in 2020 is owing to a confluence of high refinance originations as well as high purchase originations—in fact, in nominal terms, the level of purchase originations nears that seen in 2006. As for the increasing level of purchase originations, it’s consistent with high levels of home sales paired with increasing prices. Overall, refinance originations in 2020 were at their highest level since 2003. Although about 15 percent below the 2003 level in terms of nominal aggregate debt, some 7.2 million mortgages were refinanced in 2020, which was less than half the 2003 count (15 million!).

Who’s Buying? Looking Into Purchase Originations
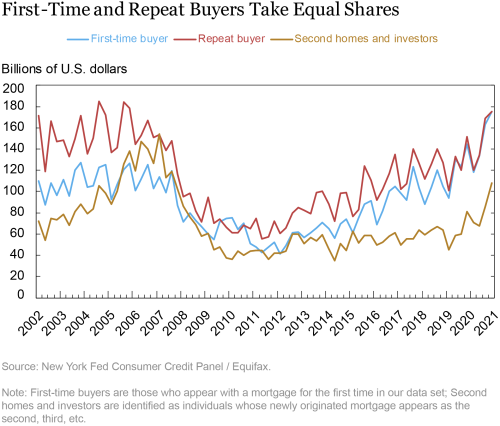
Although it is difficult to compare the volume of purchase originations with the levels seen in 2005-06 due to differences in home prices, the trend was unmistakably increasing this year, and to a high level. In the following chart, we break purchases out into three groups: (1) first-time homebuyers, or those whose origination marks the first mortgage on their credit report, shown in blue; (2) repeat buyers – individuals who are making a purchase that is not their first, shown in red; and (3) second home buyers and investors—those who have a new origination with one or more first mortgages already on their credit report. The boom years preceding the Great Recession—which similarly saw a brisk pace of mortgage originations, had the three lines at roughly equal volumes for several quarters. And then as house prices began to decline and the market began to crash, it was first-time buyers who were able to come in at a higher rate—incentivized by first-time homebuyer credits in the Housing and Economic Recovery Act, as well as declining interest rates and home prices. But during the slow recovery in originations in the past eight years, the first time and repeat buyer lines have essentially tracked each other, while second home and investor purchases have trailed, only picking up slightly in the past year.

2020 Vintage Remains Very High Quality
As we describe above, the bulk of newly originated mortgages are going to borrowers with the highest credit score. But is this because of the volume of refinance originations? In the final chart, below, we look at the median credit score of newly originated mortgages, by type. Refinanced mortgages typically go to higher score borrowers than purchase mortgages, due to their established repayment histories. However, when we break out purchasers into first-time and repeat buyers, we see that the median credit scores are quite close for refinancers and repeat buyers, while the first-time buyers have lower credit scores, and always have. The median credit score of refinancers and repeat buyers was just below 800 at the end of 2020, about 60 points higher than that of first-time buyers. With a look to the series history, new mortgages are more prime—for even first-time buyers, median credit scores have slowly drifted up since 2002-06, when they hovered in the high 600s.
Cha-Ching! Cashing Out Home Equity When the Rates Make Sense
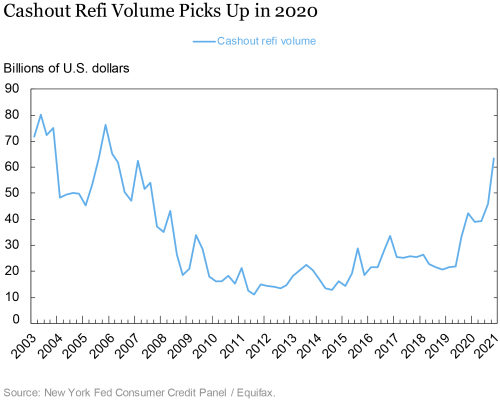
With refinances picking up in 2020, we look to see whether consumers are cashing out, and drawing against their home equity. In the chart below, we show the quarterly cashout refinance volume, which is calculated as the difference between the borrowers’ new mortgages and the mortgages that the refinances replaced. Keeping in mind that the data we present here are not adjusted for inflation, cashout refinance volume is still notably smaller than what was seen between 2003-06. However, we do see a notable increase in cashout refinance volumes, which spiked in the fourth quarter of 2020 and show no sign of abating. Homeowners withdrew $188 billion in home equity over the course of 2020. One important note though—although this is a big increase, it’s also associated with lower average cashout amounts. Borrowers who refinanced in 2019 withdrew, on average, an additional $49,000; while borrowers who refinanced in 2020 withdrew, on average, $27,000. The median cashout withdrawal in 2020 was only $6,700, suggesting that at least half of the refinancers borrowed only enough additional funds to cover the closing costs on the new mortgage. Still, a substantial minority of refinancers took out some cash from their property, which they can use to fund consumption or other investment opportunities, including home improvements. Meanwhile, borrowers who did not choose to take out extra cash saw an average savings of $200 on their monthly mortgage payment, improving their monthly household cash flow.

What To Look For Going Forward
Support for households who have suffered job and income losses has been a key feature of the CARES Act, through both the direct financial transfers to households as well as the moratoria on Federally backed mortgages and student loans. Meanwhile, many households are taking advantage of the historically low mortgage interest rates that are a consequence of the supportive monetary policy. It will be interesting to see whether households will maintain these high rates of home purchases and refinances into 2021 and more generally how households will adjust their balance sheets depending, in part, on whether and how long forbearances continue on payments on federally backed mortgages and student loans.
 Andrew F. Haughwout is a senior vice president in the Federal Reserve Bank of New York’s Research and Statistics Group.
 Donghoon Lee is an officer in the Federal Reserve Bank of New York’s Research and Statistics Group.
 Joelle Scally is a senior data strategist in the Bank’s Research and Statistics Group.
 Wilbert van der Klaauw is a senior vice president in the Bank’s Research and Statistics Group.
How to cite this post:
Andrew F. Haughwout, Donghoon Lee, Joelle Scally, and Wilbert van der Klaauw, “Mortgage Rates Decline and (Prime) Households Take Advantage,” Federal Reserve Bank of New York Liberty Street Economics, February 17, 2021, https://libertystreeteconomics.newyorkfed.org/2021/02/mortgage-rates-decline-and-prime-households-take-advantage.html.
Related Reading
Household Debt Balances Increase as Deleveraging Period Concludes
Interactive: Household Debt and Credit Report
Disclaimer
The views expressed in this post are those of the author and do not necessarily reflect the position of the Federal Reserve Bank of New York or the Federal Reserve System. Any errors or omissions are the responsibility of the author.


 RSS Feed
 Follow Liberty Street Economics