Seasonal adjustment is a key statistical procedure underlying the creation of many economic series. Large economic shocks, such as the 2007-09 downturn, can generate lasting seasonal echoes in subsequent data. In this Liberty Street Economics post, we discuss the prospects for these echo effects after last year’s sharp economic contraction by focusing on the payroll employment series published by the U.S. Bureau of Labor Statistics (BLS). We note that seasonal echoes may lead the official numbers to overstate actual changes in payroll employment modestly between March and July of this year after which distortions flip the other way.
Seasonal Echoes after the Great Recession
Many economic series present periodic patterns within each calendar year, generally referred to as seasonal effects. Statistical agencies apply statistical filters to remove these seasonal effects so that the underlying economic trends can be easily compared over time. Most analysts focus on seasonally adjusted data, without paying much attention to the unadjusted series or the adjustment process itself. It is easy then to miss just how large seasonal swings in the unadjusted economic data can be (for GDP, they are on average as big as a typical business cycle peak-to-trough fluctuation) and that the seasonal statistical filter itself can create spurious variation in the adjusted series.
A pernicious problem with seasonal adjustment comes after a big shock that is not seasonal in its origin. Since the seasonal filter determines the normal pattern for, say, January, by a weighted average of the last few Januaries, an unusual observation will have a big impact on estimated seasonal factors. For example, the worst of the 2007-09 Great Recession was in early 2009. Seasonal filters concluded that the normal employment for this time of year was lower. As a result, for the subsequent few years, an “echo” of the Great Recession took place as economic data kept exceeding the artificially low expectations for that time of year. This contributed to a pattern where economic growth seemed to be strong in the spring only to fade later on in the year, as shown by Wright (2013). The problem could be mitigated by the user making manual adjustments. In fact, the Federal Reserve Board made such an adjustment in the 2010 annual revision in the official industrial production statistics.
Seasonal Echoes after COVID-19: Payroll Employment
Last year’s recession was an order of magnitude bigger than the Great Recession. If the seasonal filter were left to run without any special adjustment, the estimated seasonal factors would be completely dominated by the within-year patterns in 2020. Agencies doing seasonal adjustment were well aware of the problem and applied manual adjustments. Agencies dislike making these ad hoc adjustments because they want the data process to be transparent. The COVID-19 recession was so extreme that such interventions were necessary as discussed by the BLS commissioner.
Do these adjustments mean that we will not see seasonal echoes of COVID-19 in the economic series in the future? We take as a case study, total nonfarm payrolls in the Current Employment Statistics (CES), produced by the BLS. This measure is perhaps the most widely watched monthly economic indicator. The BLS also posts extensive documentation of its seasonal adjustment procedure.
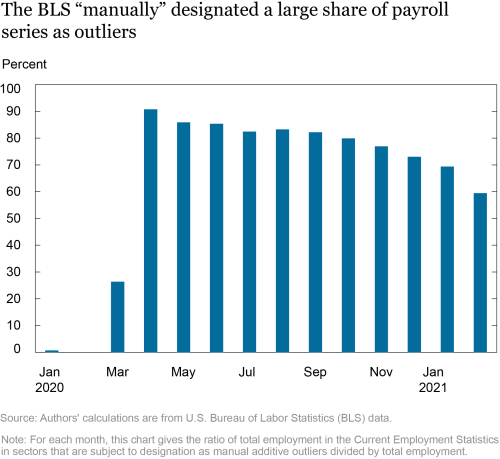
Seasonal adjustment in the CES is done at the disaggregate sectoral level. The BLS made manual adjustments first by switching many series from having “multiplicative” to “additive” factors, but also by hardcoding that a particular month for a particular disaggregate was to be treated as an “additive outlier.” Within the X-13 statistical filter, which is used by U.S. agencies for seasonal adjustment, this means that the series will be ignored for the purposes of computing the seasonal factor. X-13 also has some automatic outlier detection, which could mitigate the problem of extreme observations. But this depends on whether the automated procedure detects the outlier. Manually designating the observation as an outlier forces X-13 to exclude the presumed outlier. The chart below shows the ratio of the level of total employment in the CES in sectors that are manually treated as additive outliers to the level of total employment in all sectors, for each month since the start of 2020.

In April 2020, about 90 percent of employment was in sectors that the BLS manually treated as outliers. Since then, the BLS has very slowly reduced the overall fraction of employment that is treated as additive outliers. But even as of February 2021, most employment is in sectors that are receiving this special treatment. Naturally, the sectors that BLS is labelling as outliers are the ones most heavily influenced by the effects of COVID-19, such as airline transportation, for which every month since April 2020 has been hardcoded as an additive outlier.
If the seasonal filter were run without manual adjustment, the seasonal factors for late spring and summer would have plunged in 2020, setting up a huge seasonal echo effect. The manual adjustments greatly reduced—but did not eliminate—this echo effect. The only way of preventing the timing of COVID-19 from disrupting seasonals would be to treat every single component as an additive outlier from March 2020 onward, at least until the effects of COVID-19 are in the rearview mirror. This approach would essentially amount to projecting seasonal factors for March 2020 onward only using earlier data.
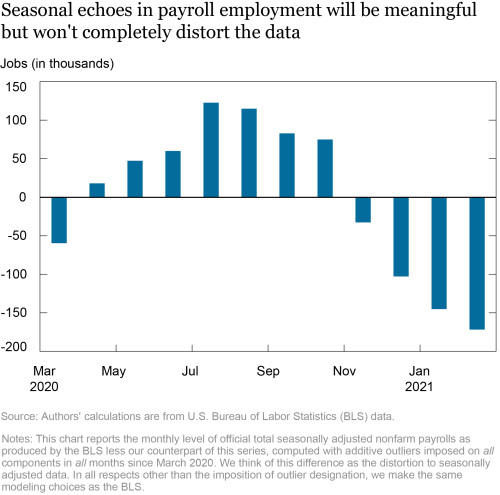
To show the possible echo effect we run an exercise of taking the BLS model specification files for seasonal adjustment in the CES and then doing the seasonal adjustment treating every single sectoral employment series as an additive outlier from March 2020 onward, while keeping everything else unchanged. For example, for series where the BLS uses a multiplicative seasonal factor, we used a multiplicative factor. We then computed seasonally adjusted total nonfarm payrolls by month and compared these with the official seasonally adjusted total nonfarm payrolls.

The chart shows the level of official seasonally adjusted payrolls less our alternative. A positive number means that the distortion is driving the seasonal factor down and making the data look better than it really is. We see that the distortions are positive in the spring and summer and negative in the fall and winter. The effects are meaningful, but won’t completely distort the data. For some months, the distortion to the level is over 100,000 payrolls and we can expect these distorted seasonals to carry over into 2021.
Most attention is given to monthly changes in payrolls, rather than the level. Our results would say that in March and April, payroll changes will be overstated by roughly 90,000 jobs per month and that there will continue to be an overstatement in payroll changes until late summer, when the distortion flips the other way. Although this echo effect is important, it is small relative to the effects of COVID-19 and the monthly job growth that would be required to get the economy back to full employment.
There are no easy answers to seasonal adjustment in this environment. The virus changed the economy and seasonal patterns, in some cases temporarily and perhaps permanently in other cases. As in our exercise, it might be desirable to treat every observation as an outlier until the economy is back to normal, or a “new normal,” and then use a “level shift” dummy to restart the estimation of seasonal factors at a new level of the economic variable. This approach would have the advantage of avoiding the echo effect, but the disadvantage that it would take longer for new seasonal patterns to be controlled for.
Seasonal Echoes after COVID-19 beyond Payroll Employment
Our numerical exercise suggests that, yes, we will see some echo effect in payroll numbers, but that this effect was greatly reduced by the interventions made by BLS. What about other series? For data released by the Bureau of Economic Analysis (BEA) in the National Income and Product Account data, such as GDP, the seasonal adjustment is done by different agencies that provide the underlying data to the BEA. Unfortunately, the process is not publicly documented and cannot be reproduced. In fact, until a few years ago, the BEA did not publish nonseasonally adjusted data. While we expect that some manual adjustments were made either by the BEA or other agencies that contribute data to the BEA, it is very hard to tell how big the seasonal echoes in important statistics, such as GDP, may be. Only time will tell.
 David Lucca is a vice president in the Federal Reserve Bank of New York’s Research and Statistics Group.
Jonathan Wright is a professor of economics at Johns Hopkins University.
How to cite this post:
David Lucca and Jonathan Wright, “Reasonable Seasonals? Seasonal Echoes in Economic Data after COVID-19,” Federal Reserve Bank of New York Liberty Street Economics, March 25, 2021, https://libertystreeteconomics.newyorkfed.org/2021/03/reasonable-seasonals-seasonal-echoes-in-economic-data-after-covid-19.html.
Disclaimer
The views expressed in this post are those of the authors and do not necessarily reflect the position of the Federal Reserve Bank of New York or the Federal Reserve System. Any errors or omissions are the responsibility of the authors.


 RSS Feed
 Follow Liberty Street Economics