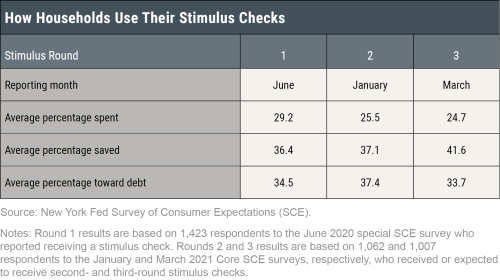
In October, we reported evidence on how households used their first economic impact payments, which they started to receive in mid-April 2020 as part of the CARES Act, and how they expected to use a second stimulus payment. In this post, we exploit new survey data to examine how households used the second round of stimulus checks, issued starting at the end of December 2020 as part of the Coronavirus Response and Relief Supplemental Appropriations (CRRSA) Act, and we investigate how they plan to use the third round authorized in March under the American Rescue Plan Act. We find remarkable stability in how stimulus checks are used over the three rounds, with a slight decline in the share dedicated to consumption and a proportional increase in the share saved. The average share of stimulus payments that households set aside for consumption—what economists call the marginal propensity to consume (MPC)—declined from 29 percent in the first round to 26 percent in the second and to 25 percent in the third.
How Households Used the Second Stimulus Check
The CRRSA Act authorized lump-sum economic impact payments of $600 to each eligible adult and child. To examine how households used these payments we draw again on the New York Fed Survey of Consumer Expectations (SCE), a nationally representative, internet-based survey of about 1,300 U.S. households. Since June 2013, the monthly survey has been collecting information on household heads’ economic expectations and behavior. In the January 2021 SCE survey, we included several questions regarding the second round of stimulus checks, whether households received such a payment and how they are using or expecting to use it.
We find that 68 percent of households reported having received an average of $1,314 ($1,200 median) in stimulus funds in this second round at the time they were surveyed. Those who had not yet received anything reported an average 35 percent chance of receiving a second-round stimulus check in the future. We also asked what share of this payment the household has already or expects to 1) spend or donate, 2) save or invest, and 3) use to pay down debts. In a follow-up question, respondents were asked to divide the share reported for the first group into categories: spending on essential items (such as necessary daily living expenses), spending on non-essential items (such as hobbies, leisure, and vacations), and donations.
Combining all respondents, we find that in January, households reported using or planning to use an average 16 percent of the second-round stimulus funds for essential spending, an average 6 percent for non-essential spending, and to donate 3 percent, resulting in a total MPC of 26 percent. They also reported saving or planning to save an average 37 percent of their stimulus checks and use 37 percent to pay down debt. These shares are very similar to those we found for the first round of stimulus checks, where households reported spending 29 percent, saving 36 percent, and using 35 percent to pay down debt. (See the table below.) The reported allocations are also in line with those that households reported back in August for a potential future second round of stimulus checks. At that point in time, they expected to use a slightly lower share for consumption (24 percent) and debt paydown (31 percent), with more expected to be saved (45 percent).

Our data allow us to assess how use of the second round of stimulus checks varies with household characteristics. For example, households making less than $40,000 report using or expecting to use 44 percent of their stimulus checks to pay down debt, while those making more than $75,000 would use or expect to use only 32 percent. Further, lower-income households are spending or expect to spend 27 percent of their stimulus payments, while higher-income households making more than $75,000 would spend 24 percent. The difference in spending on essentials is larger for the lower- and higher-income groups, 20 percent versus 12 percent. Looking at differences by education level, households without a college degree reported a slightly lower average MPC (24 percent) and a higher portion used to pay down debt (42 percent). These patterns again mirror those from our initial study of the first round of stimulus checks.
Expected Use of Third-Round Relief Payments
In March, a third round of stimulus checks of $1,400 to each eligible adult and child was authorized under the American Rescue Plan Act. In the March SCE survey, we elicited similar information about actual and expected uses of the third round of federal transfer payments. Some 32 percent of households had already received a third-round payment of on average $3,162 ($2,800 median) by the time they took the survey in March (which took place across the entire month). Those who had not yet received anything reported an average 55 percent chance of receiving a third-round stimulus check in the future. Combining all respondents, we can see in the table that respondents are using or expecting to use 25 percent this third round of payments for consumption. In particular, an average 13 percent of the latest stimulus check is expected to be spent on essential items and an average 8 percent on non-essential items.
Similar to the second round of stimulus, household heads without a college degree plan to use more of the stimulus for paying down debt and less for consumption. Those without a college degree expect allocating 37 percent toward debt while those with a college degree planned to use 27 percent for that purpose. Comparing respondents with household incomes below $40,000, between $40,000 and $75,000, and above $75,000, we find a monotonically decreasing share used toward paying down debt, and higher-income households, on average, tending to save more.
Conclusion
We find remarkable stability in the actual and expected uses of stimulus checks across successive rounds, with average MPCs of around 26 percent and with most of the funds going towards saving and debt payments. Our findings are comparable to the MPC estimate of 27 percent found by Baker et al. (2020) using high-frequency transaction data from a Fintech nonprofit, for the first round of stimulus checks. Coibion et al. (2020), using a survey of individuals participating in the Nielsen Homescan panel, find a higher MPC of 42 percent, with 27 percent of the payments going toward saving and 31 percent toward debt payments. They find that 52 percent of respondents use the check mostly to pay off debt with only 15 percent of check recipients reporting using it mostly to increase spending. Their higher MPC estimate may reflect differences in sample composition and question wording, as well a difference in time between survey completion and stimulus payment receipt.
There are reasons to think the first two rounds of stimulus payments to households have contributed to changes in aggregate spending and savings. The second round of payments coincided with a 3.0 percent increase in real aggregate consumer spending and a 9.7 percent increase in real personal income in January. Despite these increases, spending as measured by real personal consumption expenditures (PCE) remains below pre-pandemic levels of February 2020, while the personal savings rate stood at a striking 19.8 percent in January. Our findings indicate that in an environment that continues to be characterized by constraints on many activities and by high unemployment, as well as high uncertainty about the duration and continued economic impact of the pandemic (including elevated uncertainty about future inflation), fiscal support continues to impact predominantly savings instead of consumption, with households planning to use the third relief payments mostly to pay off debt and save. As the economy reopens and fear and uncertainty recede, the high levels of saving should facilitate more spending in the future. However, a great deal of uncertainty and discussion exists about the pace of this spending increase and the extent of pent-up demand.
 Oliver Armantier is an assistant vice president in the Federal Reserve Bank of New York’s Research and Statistics Group.
 Leo Goldman is a senior research analyst in the Bank’s Research and Statistics Group.
 Gizem Kosar is an economist in the Bank’s Research and Statistics Group.
 Wilbert van der Klaauw is a senior vice president in the Bank’s Research and Statistics Group.
How to cite this post:
Olivier Armantier, Leo Goldman, Gizem Koşar, and Wilbert van der Klaauw, “An Update on How Households Are Using Stimulus Checks,” Federal Reserve Bank of New York Liberty Street Economics, April 7, 2021, https://libertystreeteconomics.newyorkfed.org/2021/04/an-update-on-how-households-are-using-stimulus-checks.html.
Related Reading
How Have Households Used Their Stimulus Payments and How Would They Spend the Next? (October 13, 2020)
“Excess Savings” Are Not Excessive (April 5, 2021)
Center for Microeconomic Data—Survey of Consumer Expectations
Disclaimer
The views expressed in this post are those of the authors and do not necessarily reflect the position of the Federal Reserve Bank of New York or the Federal Reserve System. Any errors or omissions are the responsibility of the authors.


 RSS Feed
 Follow Liberty Street Economics