Total household debt rose by $85 billion in the first quarter of 2021, according to the latest Quarterly Report on Household Debt and Credit from the New York Fed’s Center for Microeconomic Data. Since the start of the pandemic, household debt balances have increased in every quarter but one—the second quarter of 2020, when lockdowns were in full effect. The Quarterly Report and this analysis are based on the New York Fed’s Consumer Credit Panel, which is drawn from anonymized Equifax credit data.
The growth of the overall debt balance masks some unusual dynamics in each of the individual debt types. Mortgage balances have grown steadily through the past year, boosted by record-high levels of mortgage originations. Auto loan balances have grown for the past three quarters and increased by $8 billion in the first quarter of 2021, after a brief pause in the second quarter of 2020, when many dealerships were closed. Despite the closures, 2020 in fact saw a record volume of auto loan originations.
One of the most confounding changes in debt balances is that of credit cards. In the first quarter of 2021, balances shrunk by $49 billion, the second largest decline in the history of the time series, which begins in 1999. The largest such decline occurred–perhaps unsurprisingly—in the second quarter of 2020, during which credit card balances shrank by $76 billion (and retail sales plunged) amid limited consumption opportunities and strict stay-at-home orders. But the decline in the first quarter of 2021 is remarkable because it stands in sharp contrast to the recovery underway in the retail sector as the U.S. economy reopens and travel resumes.
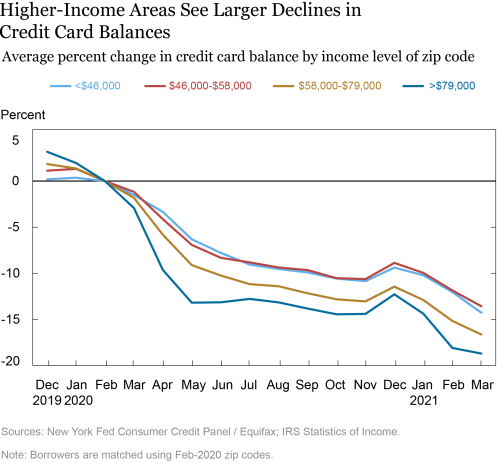
In any case, it appears that many households are working to reduce their revolving debt balances, and this is happening across the board. The chart below disaggregates credit card balances by the income of the borrower’s neighborhood, taken from the IRS Statistics of Income. As income is not reported in credit bureau data, we group individuals using the average income in the zip code on their credit file. Credit card borrowers in the two lower income areas reduced their card balances by 15 percent in the year since the pandemic began, while those in the highest income zip codes saw a 19 percent reduction.
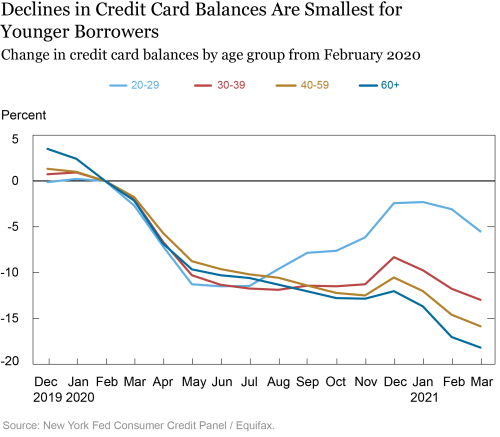
In the second chart, we look at balances by age group. We see that credit card debt fell by about 10 percent between February and the summer of 2020 for all age groups, but since then the trends have diverged across age groups. For borrowers in their 20s, balances were nearly back to their previous level by the end of the year, but balances continued to decline for older borrowers, particularly those aged 60 and over, except for a seasonal increase at the end of the year. We think this reflects, to an extent, the differential response to the risks from the virus itself—younger people have begun to resume their outside activities, while older people were more likely to remain cautious about the risk, opting to continue to stay home.
The COVID-19 pandemic and its economic impacts have dragged on for more than a year now, but the mark on household borrowing has been varied and irregular, due in part to the large-scale fiscal support extended to households and the unequal impact of the pandemic across U.S. households. Certainly, the decline in card balances should be interpreted with caution, as we are unable to distinguish between new spending and older, carried-over balances. But surging retail sales volumes suggest stimulus checks, forbearance programs, increasing consumer confidence, and pent-up demand may be both supporting consumption and serving to help borrowers reduce expensive revolving debt balances.
 Andrew Haughwout is a senior vice president in the Federal Reserve Bank of New York’s Research and Statistics Group.
 Donghoon Lee is an officer in the Bank’s Research and Statistics Group.
 Joelle Scally is a senior data strategist in the Bank’s Research and Statistics Group.
 Wilbert van der Klaauw is a senior vice president in the Bank’s Research and Statistics Group.
How to cite this post:
Andrew Haughwout, Donghoon Lee, Joelle Scally, and Wilbert van der Klaauw, “Credit Card Balance Declines Are Largest Among Older, Wealthier Borrowers,” Federal Reserve Bank of New York Liberty Street Economics, May 12, 2021, https://libertystreeteconomics.newyorkfed.org/2021/05/just-released-credit-card-balance-declines-largest-among-older-wealthier-borrowers.html.
Disclaimer
The views expressed in this post are those of the authors and do not necessarily reflect the position of the Federal Reserve Bank of New York or the Federal Reserve System. Any errors or omissions are the responsibility of the authors.


 RSS Feed
 Follow Liberty Street Economics