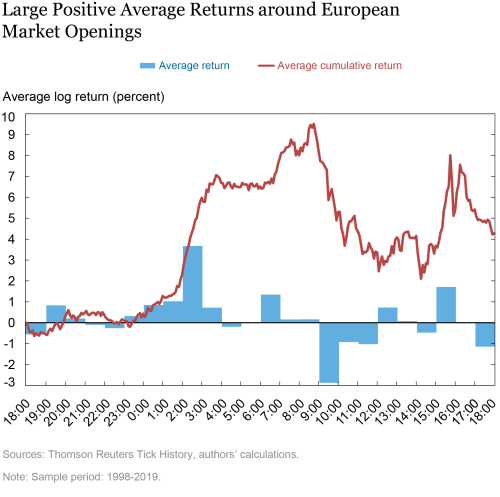
Since the advent of electronic trading in the late 1990s, S&P 500 futures have traded close to 24 hours a day. In this post, which draws on our recent Staff Report, we document that holding U.S. equity futures overnight has earned a large positive return during the opening hours of European markets. The largest positive returns in the 1998–2019 sample have accrued between 2 a.m. and 3 a.m. U.S. Eastern time—the opening of European stock markets—and averaged 3.6 percent on an annualized basis, a phenomenon we call the overnight drift.
A First Look at the Overnight Drift
The chart below summarizes the overnight drift phenomenon. The blue bars plot the annualized hour-by-hour average returns across all trading days in our sample, while the red line plots the corresponding cumulative average returns. Over the last twenty years, overnight returns have been large and positive between 12 a.m. and 3 a.m. U.S. Eastern time. Indeed, the full overnight trading session, that is, the trading between 4:15 p.m. and 9:30 a.m., has on average generated 2.6 percent annualized returns, constituting more than half of the 4.3 percent annualized close-to-close return during our sample period. Moreover, most of the overnight return occurs in the window between 2 a.m. and 3 a.m., when the European stock markets open.
In contrast, the opening of the U.S. market at 9:30 am is preceded by large negative returns, a pattern we call “opening reversal,” with returns continuing to be negative on average until 12 p.m. Intraday returns are then roughly flat until 3 p.m., and are only positive on average during the last seventy-five minutes of trading prior to the closing of open outcry futures trading at 4:15 p.m.
A natural question is whether the opening reversal is just the reverse side of the overnight drift coin. In the Staff Report, we show that the answer is no. First, while the overnight drift is positive and statistically significant on all days of the week, the opening reversals are only statistically significantly negative on Thursdays and Fridays. Second, in a daily regression of opening returns on the preceding overnight drift returns, we find that the opening reversal is weakly positively related to the overnight drift, suggesting that the opening reversal is unlikely to be a reversal of the overnight drift.
Inventory Risk Explanation for Overnight Drift
What can explain the overnight drift? We argue that, consistent with models of immediacy, such as Grossman and Miller (1988), the overnight drift is compensation for liquidity provision at the end of the trading day. In particular, suppose that there is selling pressure during the trading day, translating into an overall negative order imbalance by the end of trading day. In this scenario, market makers become net buyers in the S&P 500 futures market, bearing inventory risk until they are able to sell to new market participants; however, they demand compensation for this risk in positive expected return terms. That is, market makers are willing to take on the inventory risk at the end of the U.S. trading day because they expect to be able to sell this inventory at a higher price. As new market participants arrive—overnight due to the round-the-clock trading in this market—market makers offload their inventory and prices gradually rise.
In the Staff Report, we conduct a number of tests to show that the overnight drift is indeed compensation for providing end-of-day liquidity and seems to be unrelated to alternative explanations, such as firm and macroeconomic announcements and overnight resolution of uncertainty. We summarize here two of such tests.
Overnight Drift is Larger following Large Order Imbalance Days
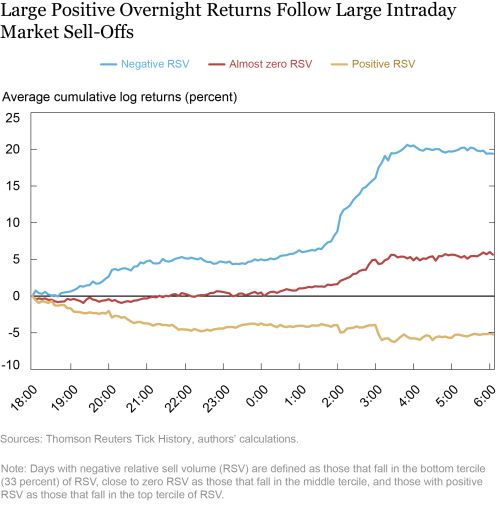
If market makers earn the overnight drift as compensation for bearing inventory risk, then overnight drift should be higher following larger end-of-day order imbalances: when market makers have to absorb more inventory, they should be compensated more. The next chart plots the overnight cumulative returns sorted on relative signed volume at the end of the preceding trading day. The chart shows that, indeed, the overnight drift is highest and most positive during nights following market sell-offs (negative end-of-day order imbalances).
When order imbalances are in the bottom tercile (most negative order imbalances), contemporaneous annualized closing returns are on average -81 percent. The subsequent overnight returns average 7.6 percent during Asian hours and 12.4 percent during European hours, such that the overnight reversal bounces back by 20 percent. Of the 20 percent reversal, returns earned around the opening of European markets between 2:00 a.m. and 3:00 a.m. equal 7.5 percent.
Price reversals following market rallies are much more modest: When order imbalances are in the top tercile (most positive order imbalances), contemporaneous annualized closing returns are on average 81 percent but the subsequent overnight returns average -1.5 percent during Asian hours, and -5.1 percent during European hours, and there is no reversal effect between 2:00 a.m. – 3:00 a.m. Eastern time. Thus, although market sell-offs and market rallies at the U.S. close are similar in magnitude (though, naturally, of opposite sign), positive closing order imbalances lead to much smaller price reversals than negative closing imbalances, generating an unconditional positive overnight drift. We speculate that this asymmetry is related to time-varying risk aversion, which arguably increases during bad states (market sell-offs) more so than during good states.
Overnight Drift Occurs Earlier When Overnight Traders Arrive Earlier
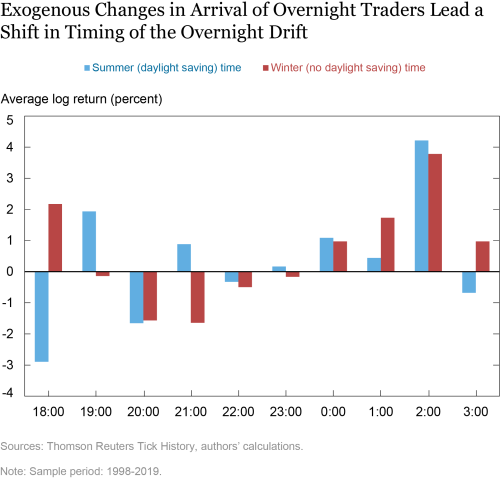
Although the result that overnight returns—and, in particular, overnight returns during the opening of European financial markets—are predictable by end-of-day order imbalances is suggestive evidence of the inventory risk management explanation, such predictive relationships are usually plagued with endogeneity concerns. The round-the-clock nature of the market, however, allows us to conduct a novel natural experiment to address this concern. More specifically, we exploit the time difference between the United States and Japan: While the U.S. observes daylight savings time (DST), Japan does not. Thus, seen from the perspective of a U.S. trader, the timing of the Japanese market opening changes exogenously from 7 p.m. in winter to 8 p.m. in summer. Indeed, as shown in the chart below, accounting for DST, return predictability around the Tokyo open shifts forward by one hour when moving from winter to summer time, so that exogenous variation in the time of arrival of liquidity traders leads to predictable variation in the returns earned overnight.
Conclusion
Since the advent of electronic trading in U.S. equity futures in 1998, S&P 500 futures returns have exhibited a positive drift around the opening hours of overseas exchanges, as market makers take the earliest available opportunity to bring their inventories back to neutral. While this overnight drift was earned almost exclusively around the opening of European markets in the first ten years, the overnight drift has migrated to the opening of Asian financial markets as trading during Asian market hours has increased over time. Thus, as the market for U.S. equity futures becomes more global, market makers are able to offset closing-time order imbalances more quickly, demonstrating a positive role for financial market globalization.
 Nina Boyarchenko is a research officer in the Federal Reserve Bank of New York’s Research and Statistics Group.
Lars C. Larsen is a PhD Fellow at the Copenhagen Business School.
Paul Whelan is an assistant professor in the Department of Finance at the Copenhagen Business School.
How to cite this post:
Nina Boyarchenko, Lars C. Larsen, and Paul Whelan, “The Overnight Drift in U.S. Equity Returns,” Federal Reserve Bank of New York Liberty Street Economics, May 26, 2021, https://libertystreeteconomics.newyorkfed.org/2021/05/the-overnight-drift-in-us-equity-returns.html.
Related Reading
Staff Report: The Overnight Drift (Rev. February 2021)
Lunch Anyone? Volatility on the Tokyo Stock Exchange around the Lunch Break on May 23, 2013, and Stock Market Circuit Breakers (April 2014)
Disclaimer
The views expressed in this post are those of the authors and do not necessarily reflect the position of the Federal Reserve Bank of New York or the Federal Reserve System. Any errors or omissions are the responsibility of the author.


 RSS Feed
 Follow Liberty Street Economics