A number of studies have documented that market concentration among U.S. firms has increased over the last decades, as large firms have grown more dominant. In a new study, we examine whether this rising domestic concentration means that large U.S. firms have more market power in the manufacturing sector. Our research argues that increasing foreign competition over the last few decades has in fact reduced U.S. firms’ market power in manufacturing.
Measuring Market Power
A rise in market power is often interpreted to mean that firms can increase their markups over marginal cost without sacrificing profitability. However, markups are unobservable, which helps explain why different studies don’t agree on whether aggregate markups have risen or not. Our interpretation of market power relies on a large class of international trade models, where firms with a higher market share set higher markups. Through the lens of these models, as market concentration rises, aggregate markups increase. Higher markups are undesirable from the perspective of consumers because they redistribute income from consumers to producers.
Data
Our analysis draws on confidential firm-level data from the U.S. Census Bureau from 1992 to 2012 for industries in the manufacturing sector. Importantly, it includes sales data for all firms selling in the U.S. market, both domestic and foreign firms. Foreign firm sales are available from customs forms collected by U.S. Customs and Border Protection and available through the Census. Usually, the sales of foreign firms to the U.S. market are not included in analyses of market concentration as publicly available data only comprise U.S. firms’ sales. However, in order to get an accurate picture of market concentration, it is critical to also include the sales of foreign competitors in the market. For example, a car manufacturer in the United States not only competes with domestic car manufacturers but also with imported cars. We use the market share of the top twenty firms in an industry as our measure of market concentration.
Has Market Concentration Increased?
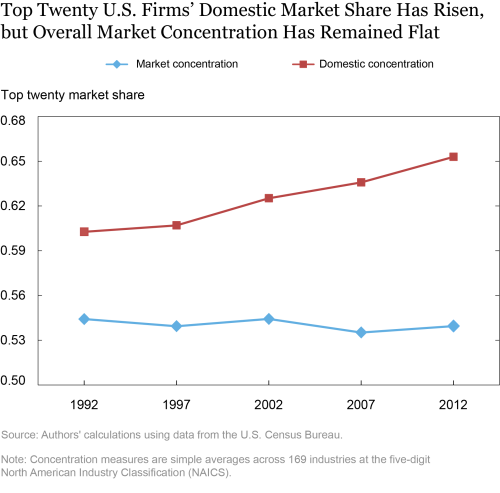
In the chart below, we plot the market concentration, averaged across all industries within manufacturing. The solid red line depicts domestic concentration, computed using U.S. firms’ total shipments, that is, the market share of the top twenty U.S. firms relative to other U.S. firms. As in earlier studies, we find that this domestic market concentration measure has increased. However, once we compute market concentration using all firms selling in the United States, inclusive of foreign firms, we find that market concentration has in fact remained stable (blue line). This finding suggests that aggregate markups computed using both foreign and domestic firms have remained stable.
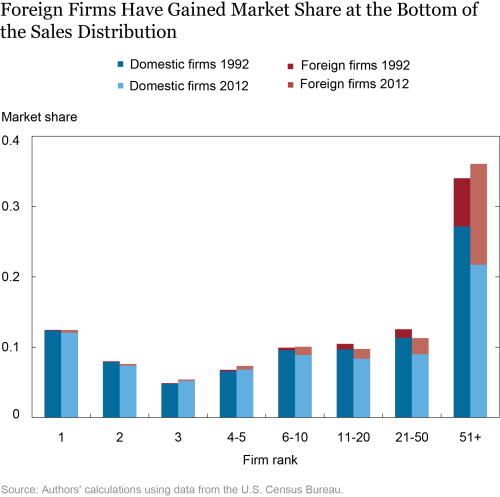
The previous chart suggests that the fall in the market share of the top U.S. firms is exactly offset by the rise in the share of the foreign firms. In the chart below, we plot what share of the market is accounted for by firms of a given ranking summed across industries. To see how these shares evolved, we plot the information for 1992 with darker colors and for 2012 with lighter colors. We split each bar into the market share accounted for by domestic firms in blue and by foreign firms in red. The chart shows that in 1992 domestic firms with rank 1 had a market share of 12.4 percent, which fell to 12.0 percent in 2012. At the same time, foreign firms with rank 1 increased their market share from virtually zero to 0.4 percent of manufacturing sales. We see that the largest gain in foreign firm market shares has been in the lower part of the distribution. The market share of foreign firms ranked higher than fiftieth within an industry rose from 6.9 percent to 14.4 percent. There is very little gain by foreign firms in the top part of the market share distribution.
Market Concentration and Import Competition
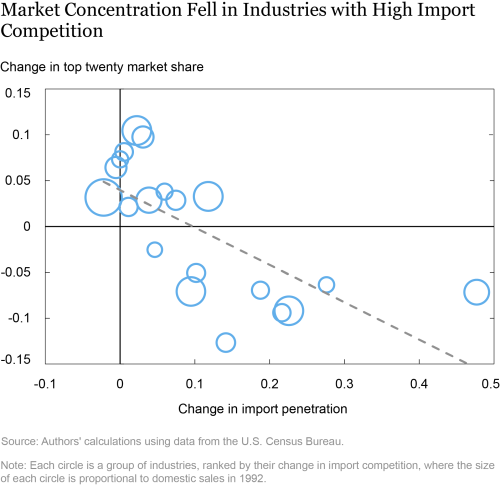
Market concentration fell mostly in those industries that experienced the fastest growth in import competition since 1992. In contrast, concentration grew in industries with low import competition. The next chart plots an industry’s change in import penetration between 1992 and 2012 against the change in concentration over the same period. Import penetration is defined as an industry’s imports divided by domestic sales, that is, shipments minus exports plus imports. Each circle is a group of industries, ranked by their change in import competition, where the size of each circle is proportional to domestic sales in 1992. The dashed line depicts the linear fit of these circles. We find that industries exposed to increasing import penetration saw a decline in concentration, while concentration grew in industries that have a low number of foreign firms. Publicly available data from the Census Bureau show that the former group of industries includes, for example, audio and video equipment manufacturing, while the latter group includes, for example, concrete manufacturing.
How do we reconcile the different trends in domestic concentration and overall market concentration? According to trade theory, tougher import competition leads to the exit of smaller, inefficient U.S. firms and reduces U.S. firms’ domestic sales. At the same time, large U.S. firms gain because trade liberalization allows them to export more. Consistent with these predictions, we find based on regression analysis that import competition caused the exit of domestic firms, and thus the large U.S. firms gained market share relative to total sales of U.S. firms. However, once we consider the total sales in the U.S. market, inclusive of imports, we find that import competition caused the market share of the largest U.S. firms to fall, as foreign firms gained some of the domestic firms’ market share. Our results suggest that import competition reduced the market share of the top twenty U.S. firms by an average of about 0.8 percentage point since 1997, accounting for about half of the actual decline in their market shares.
What do these findings imply for the market power of U.S. firms? In light of the predictions of many trade models, our findings suggest that the market power of large U.S. firms has actually fallen in many industries since their share in the overall market has declined. In sum, our analysis suggests that the increasing concentration among U.S. firms themselves is entirely consistent with lower markups of these firms because of tougher import competition.
 Mary Amiti is a vice president in the Federal Reserve Bank of New York’s Research and Statistics Group.
 Sebastian Heise is an economist in the Bank’s Research and Statistics Group.
How to cite this post:
Mary Amiti and Sebastian Heise, “Has Market Power of U.S. Firms Increased?,” Federal Reserve Bank of New York Liberty Street Economics, June 21, 2021, https://libertystreeteconomics.newyorkfed.org/2021/06/has-market-power-of-us-firms-increased.html
Disclaimer
The views expressed in this post are those of the authors and do not necessarily reflect the position of the Federal Reserve Bank of New York or the Federal Reserve System. Any errors or omissions are the responsibility of the authors.


 RSS Feed
 Follow Liberty Street Economics