


A critical risk during the COVID-19 pandemic has been the possibility of the hospital system becoming overwhelmed. COVID-19 not only has killed nearly 2 percent of people with confirmed infections but causes many more who contract it to develop severe complications that are potentially fatal if not treated in an intensive care unit (ICU). As ICU capacity is based on typical needs for intensive care before the pandemic, a surge of COVID-related ICU patients may leave no room for individuals requiring intensive care for other reasons—such as heart attacks—or may exceed the total ICU capacity to treat even COVID-19 patients. In this post, we investigate the extent to which members of different racial and ethnic groups faced different levels of hospital system stress during the “third wave” of COVID-19 in the winter of 2021, which, as the largest wave to hit the United States, briefly brought intensive care units around the country to the point of being overwhelmed. We find that while Black and Hispanic individuals faced the greatest exposure to overburdened ICUs over the course of the third wave from beginning to end, Asian American and Pacific Islanders (AAPI) went from experiencing more stable ICU capacities than the national average at the beginning of the wave to a nearly overwhelmed ICU system at its peak.
To measure occupancy rates in hospital ICUs, we use data on admissions and capacity by facility released by the U.S. Department of Health and Human Services. The data present a nearly complete census of all hospitals in the United States for every week between August 1, 2020, and the present. While this data set presents considerable additional information, two elements that are critical for this analysis are the number of ICU patients (both COVID and non-COVID) and the number of beds set up and staffed in each ICU for each week of the data. Additionally, the data contain the zip code of each hospital, allowing it to be matched with disaggregated demographic data for a more detailed analysis. We combine the hospital data with zip code level demographic data from the 2015-19 five-year American Community Survey (ACS), which record the average number of individuals in each zip code who identified as white, Black, Hispanic, AAPI, and American Indian or Alaskan Native (AIAN).
The metric that we use to measure stress on the ICU system is a local occupancy rate: the number of ICU patients divided by number of staffed ICU beds within a certain distance of the center of the zip code in which a person lives. We use a distance of ten miles, which is the average distance traveled by rural Americans for hospital care, with urban and suburban Americans traveling shorter distances on average. Regardless, there is a wide variation in distance traveled determined by the geographic distribution of hospital care. Given that patients with severe COVID-19 have been transferred to more distant hospitals in cases of severe health system stress, sometimes across state lines, we have also experimented with distances of 30, 50, or 100 miles. At shorter distances, our analysis drops zip codes that do not have hospitals within the radius under consideration, however this is progressively less problematic as we increase the radius.
We find that 95 percent of the population is covered under our ten-mile radius results while 99.8 percent of the population is included at a fifty-mile radius. Importantly, our results across these various radii remain very similar. Our goal is to look at the differences in average occupancy rates faced by members of different demographic groups. We do this by computing the weekly occupancy rate in the ten-mile radius around the centroids of each of the 30,000-plus zip codes in the United States that have demographic information available in the ACS. We then take the average of these occupancy rates, weighting by the population of a demographic group from the corresponding zip code to get national estimates of occupancy rates for each of the demographic groups we consider. So, for example, the average occupancy rate that AAPI individuals face during the week is calculated as the average of the occupancy rates for all zip codes during that week, weighted by the number of AAPI individuals in the corresponding zip code.
The chart below computes average occupancy rates for the five demographic groups that we consider as of the week starting October 30, 2020, at the beginning of the third wave of the pandemic in the United States. New weekly nationwide cases started increasing several weeks previously, but as there is a lag between new cases and new hospitalizations, ICUs did not begin to be stressed until the following month. The average American faced the situation of 71.5 percent of ICU beds being occupied within 10 miles of their zip code. According to the Utah Department of Health, an occupancy rate of 72 percent (represented in the chart as a dashed line) is at the threshold of being a cause for concern, while an 85 percent rate marks a threshold for an “overwhelmed” hospital system. However, different racial and demographic groups were in different situations. Black Americans faced occupancy rates of over 74 percent on average, while Hispanic and AIAN Americans faced occupancy rates of just over 72 percent, experiencing ICU stress that was clearly a cause for concern. The high ICU occupancy rate faced by AIAN individuals was likely because, by late October, the COVID-19 wave was already sweeping over many of the states that have a relatively high density of Native Americans, such as Alaska, Washington, Montana, Idaho, Nevada, New Mexico, Oklahoma, and South Dakota. White Americans experienced a lower-than-average occupancy rate of 71 percent and AAPI individuals experienced an occupancy rate of less than 70 percent, the lowest of all the racial and ethnic groups considered.
Black Americans Faced the Highest ICU Stress at the Beginning of the Third Wave
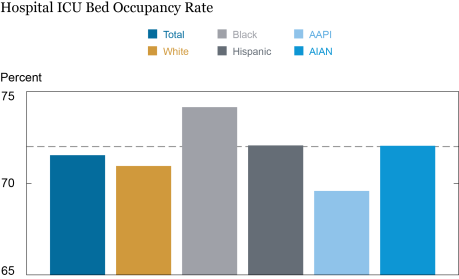
Source: Authors’ calculations.
Notes: Data are as on October 30, 2020. The dashed line denotes a 72 percent ICU occupancy rate at hospitals within a ten-mile radius, a threshold signaling a situation of concern. AAPI are Asian-American and Pacific Islanders. AIAN are American Indian or Alaskan Native.
We also consider the fraction of the overall population and of the five demographic groups that lived in zip codes that faced an overwhelmed hospital system—with at least 85 percent ICU occupancy rates in their ten-mile radius in the week starting October 30. Our analysis finds that 21 percent of the population lived in such zip codes. Differentiating by race, we find that 22 percent of whites, 25 percent of Blacks, 19 percent of Hispanics, 15 percent of AAPI, and 26 percent of AIAN faced at least 85 percent ICU occupancy rates.
Hispanic Americans Faced the Highest ICU Stress at the Peak of the Third Wave
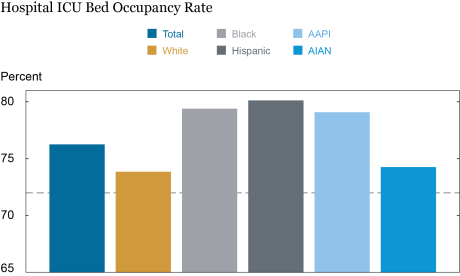
Source: Authors’ calculations.
Notes: Data are as on January 29, 2021. The dashed line denotes a 72 percent ICU occupancy rate at hospitals within a ten-mile radius, a threshold signaling a situation of concern. AAPI are Asian-American and Pacific Islanders. AIAN are American Indian or Alaskan Native.
We now consider changes in ICU occupancy rates by demographic group by the height of the third wave in late January 2021. By this time, every ethnic group was experiencing occupancy rates of well over 72 percent, with the average being over 76 percent. As was the case at the beginning of the third wave, the average white American experienced an occupancy rate below the national average (but, at nearly 74 percent, above the concern threshold), while the average Black American experienced an occupancy rate of over 79 percent, well above the national average. However, the relative hospital stress of the other racial and ethnic groups changed over the course of the wave. AAPI individuals, who experienced the lowest occupancy rate as the third wave was beginning, now faced a rate of just over 79 percent, marginally lower than that for Black Americans. Hispanic Americans, who in late October were close to the national average of hospital occupancy, now had the highest occupancy rate of nearly 80 percent, with many hospitals in nearby zip codes being close to overwhelmed. By contrast, AIAN individuals experienced a much smaller increase in the occupancy rate they faced between the start and the peak of the wave, placing them slightly above white Americans. These patterns likely can be accounted for by the shifting geography of the third wave which moved into the western and southern states (for example, California, Nevada, New Mexico, Texas, Virginia, and Maryland) that are home to large fractions of the Hispanic- and Asian-American populations.
Additionally, we look at the share of the total population and of the various racial groups that faced at least 85 percent ICU occupancy rates, or an overwhelmed hospital system, within ten-mile radii of their zip codes at the peak of the third wave. The analysis finds that 35 percent of the total population faced an overwhelmed hospital system, but there were notable differences by race. Distinguishing by race, we find that 30 percent of white Americans, 37 percent of Black Americans, 48 percent of Hispanic Americans, 41 percent of AAPIs, and 33 percent of AIANs experienced this situation.
Finally, we look at hospital occupancy at the end of the third wave, at the beginning of May 2021, after a sizeable proportion of the U.S. population had become vaccinated, leading to a sharp decline in cases, deaths, and hospitalizations. The average American now faced an occupancy rate just below 70 percent, well below the concern threshold. Black and Hispanic Americans continued to experience higher occupancy rates than the average (for example, the occupancy rate experienced by the average Black American was slightly above the concern threshold of 72 percent), while white, AAPIs, and AIANs faced below-average occupancy rates. Much of these declines came from the overall ebbing of the third wave in the face of a concerted vaccination effort, although some of them came from a shift of the pandemic away from the West and towards the Southeast and the mid-Atlantic states, such as Alabama, Mississippi, Georgia, Florida, North Carolina, West Virginia, and Pennsylvania.
Additionally, as above for the beginning and the peak of the third wave, we explore the data to understand what share of Americans faced an overwhelmed (at least 85 percent occupancy rate) hospital system at the end of the third wave. We find marked heterogeneity by our five racial groups—20 percent of white Americans, 23 percent of Black Americans, 21 percent of Hispanic Americans, 15 percent of AAPI Americans, and 21 percent of AIAN Americans faced at least 85 percent occupancy rates.
At the End of the Third Wave, Black Americans Continued to Face Levels of ICU Stress above Concerning
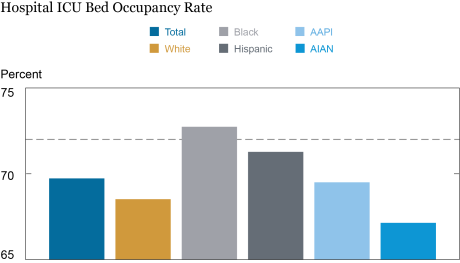
Source: Authors’ calculations.
Notes: Data are as on May 7, 2021. The dashed line denotes a 72 percent ICU occupancy rate at hospitals within a ten-mile radius, a threshold signaling a situation of concern. AAPI are Asian-American and Pacific Islanders. AIAN are American Indian or Alaskan Native.
Notably, our analysis shows that on average, Black and Hispanic Americans faced the highest ICU occupancy rates during the course of the third wave. While the especially high levels of occupancy rates (often close to or above concerning levels) for the various groups were driven by the pandemic, the differences in occupancy rates across races were at least partly manifestations of systemic differences that existed before the pandemic, in times when the hospital system was not stressed. While we do not have pre-pandemic data (our data start in August 2020), data from the week starting on June 11, close to the point at which the pandemic was at its lowest intensity, possibly comes closest to pre-pandemic time. Probing these data, we find that the average American faced an occupancy rate of 68 percent, with Black and Hispanic Americans facing the highest occupancy rates at 71 percent and 70 percent respectively, and white, AAPI, and AIAN Americans respectively facing 67 percent, 68 percent, and 67 percent occupancy rates.

Ruchi Avtar is a senior research analyst in the Federal Reserve Bank of New York’s Research and Statistics Group.

Rajashri Chakrabarti is a senior economist in the Bank’s Research and Statistics Group.

Maxim Pinkovskiy is a senior economist in the Bank’s Research and Statistics Group.
How to cite this post:
Ruchi Avtar, Rajashri Chakrabarti, and Maxim Pinkovskiy, “Unequal Burdens: Racial Differences in ICU Stress during the Third Wave of COVID-19,” Federal Reserve Bank of New York Liberty Street Economics, August 9, 2021, https://libertystreeteconomics.newyorkfed.org/2021/08/unequal-burdens-racial-differences-in-icu-stress-during-the-third-wave-of-covid.
Disclaimer
The views expressed in this post are those of the authors and do not necessarily reflect the position of the Federal Reserve Bank of New York or the Federal Reserve System. Any errors or omissions are the responsibility of the authors.
 RSS Feed
 Follow Liberty Street Economics