


During the pandemic, national home values and housing activity soared as mortgage rates declined to historic lows. Under the canonical “user cost” house price model, home values are held to be very sensitive to interest rates, especially at low interest rate levels. A calibration of this model can account for the house price boom with the observed decline in interest rates. But empirically, we find that home values are nowhere near as sensitive to interest rates as the user cost model predicts. This lower sensitivity is also found in prior economic research. Thus, the historical experience suggests that lower interest rates can only account for a tiny fraction of the pandemic house price boom. Instead, we find more scope for lower interest rates to explain the rise in housing activity, both sales and construction.
Since February 2020, national home values have risen more than 15 percent across several house price indices. At the same time, existing home sales and building permits for new privately owned housing units have soared to levels last seen in 2007, and Q4/Q4 real residential investment, as measured by the Bureau of Economic Analysis, grew about 16 percent in 2020. Thirty-year fixed rate mortgage rates dropped to an historic low of 2.7 percent in December 2020. At 3 percent during the summer of 2021, mortgage rates remain depressed and 50 basis points below February 2020 levels. How much of the housing boom can be explained with the lower level of interest rates?
Elasticity of House Prices to Mortgage Rates in Theory: The User Cost Model
Standard calibrations of the most popular theoretical framework of housing valuation—the user cost model—can in fact quantitatively explain the rise in house prices with the decline in interest rates. In its simplest form, the model postulates that the raw return on housing, including both the rent yield and growth of rent, should be equal to the sum of borrowing cost and property taxes, maintenance, and insurance (taking housing supply and rents as given):

where ![]() is the rent to price yield, g is the expected capital gain rate, ρ is the effective borrowing cost (mortgage rate after tax deduction), and τ accounts for property taxes, maintenance, and insurance.
is the rent to price yield, g is the expected capital gain rate, ρ is the effective borrowing cost (mortgage rate after tax deduction), and τ accounts for property taxes, maintenance, and insurance.
From this formula, we can calculate how much home prices rise for every 1 percentage point decline in the mortgage rate, or the semi-elasticity of house prices to changes in mortgage rates, which we refer to as the “semi-elasticity.” The chart below illustrates the predicted semi-elasticity under a set of commonly used parameters from Himmelberg et al. (2005) (marginal tax rate at 25 percent, property taxes, maintenance and insurance in total at 4 percent, growth of rent at 3.8 percent). Importantly, the semi-elasticity rises as interest rates decline, meaning that house prices become particularly sensitive to interest rate changes in a low-rate environment. For example, the semi-elasticity is about 23 when mortgage rates are at 4 percent, but it increases to about 30 when mortgage rates are at 3 percent. These statistics suggest that a decline in the mortgage rate from 3.5 percent to 3 percent would cause home prices to rise about 14 percent, which is just about as we observed. But as we show in the rest of the post, these predicted effects are much larger than our empirical estimates and those found in the economic literature.
User Cost Model Predicts High Sensitivity of House Prices to Mortgage Rates
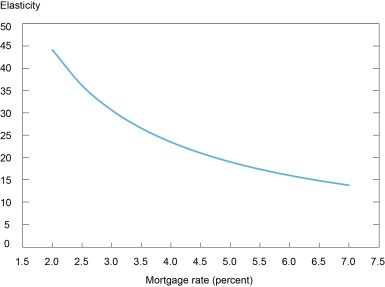
Note: This graph plots the semi-elasticity of house prices to changes in the mortgage rate as a function of the mortgage rate, or how much home prices rise for every 1 percentage point decline in the mortgage rate.
Source: Authors’ calculations.
Elasticity of House Prices and Activity to Mortgage Rates in Practice: Empirical Evidence
We use a Jorda (2005) linear projection framework and quarterly macroeconomic data between 1975 and 2020 to study the semi-elasticity of the FHFA house price index, building permits for single-family units, existing home sales, and residential investment (rescaled as a contribution to real GDP). Estimating the semi-elasticity to interest rates using macroeconomic data is challenging because movements in mortgage rates depend on the state of the economy, which is a confounding factor. Our first econometric specification (no contemporaneous controls) accounts for the economic state by including past realizations of the unemployment rate, the 1-year Treasury rate (as a proxy for monetary policy), and CPI inflation. In the second specification (contemporaneous controls), we include these controls contemporaneously, so that the estimated semi-elasticity only reflects changes in the residual mortgage rate component, which is driven by term premia for long-term rates and the mortgage basis (or spread). All specifications also include lags of each housing variable, so that the linear projections are equivalent to impulse responses from vector autoregressions commonly used in empirical macroeconomic analysis (Plagborg-Moller and Wolf 2021).
The chart below shows the response of each variable when excluding (orange) and including (blue) the contemporaneous controls after a 1 percentage point decline in the mortgage rate. We find significant effects, with the expected signs, and with stronger and more persistent responses when not including controls. The (maximum) semi-elasticity of house prices to mortgage rates is -2, with or without contemporaneous controls. This is less than a tenth as large as what is predicted by the user cost model. Housing activity is, instead, very sensitive to mortgage rates. After a 1 percentage point decline in mortgage rates, permits rise more than 10 percent, existing homes sales increase 5-10 percent, and residential investment expressed as a contribution to real GDP increases 0.3 percentage point (0.2 percentage point with controls).
Mortage Rates Affect House Prices and Housing Activities
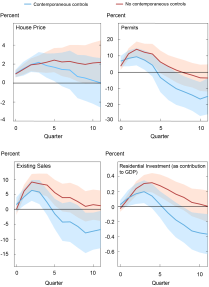
Notes: The above charts show impulse responses to a 100 basis point (or 1 percentage point) decline in mortgage rates from linear projections (LPs). The LPs include lags of each dependent variable, mortgage rates, and a set of controls that include the unemployment rate, the 1-year Treasury rate (as proxy for monetary policy), and CPI inflation. The “contemporaneous controls” specification includes these controls up to quarter 0. Blue and orange bands are 90 percent confidence bands for the model, including contemporaneous controls and only lagged controls.
Sources: Authors’ calculations, based on data from Federal Reserve Board, Bureau of Labor Statistics, Freddie Mac, FHFA, Census Bureau, National Association of Realtors, and Bureau of Economic Analysis.
Elasticity of House Prices to Mortgage Rates in Practice: Prior Research
To what extent are our results specific to our statistical model? Prior research uses both macro and micro data to estimate the semi-elasticity of house prices to interest rates (in contrast, few studies look at the response of housing activity to interest rates). As shown in the table below, most empirical estimates from this literature suggest that house prices increase by less than 5 percent for every 1 percentage point decrease in (long-term) interest rates–substantially less than implied by the user cost model and consistent with our results.
Estimated Effects of Interest Rates on House Prices
| Paper | U.S./ International | Method | Home Price Appreciation After a 1 Percentage Point Drop in the Mortgage Rate |
| Macro Papers: | |||
| Del Negro and Otrok 2007 | U.S. | VAR | 0.8 |
| Goodhart and Hofmann 2008 | International | VAR | 1.6 |
| Jarocinski and Smets 2008 | U.S. | VAR | 2 |
| Sa, Towbin, and Wieladek, 2011 | International | VAR | 1.2 |
| Williams 2015 | International | Fixed exchange rate | 6.3 |
| Micro Papers: | |||
| DeFusco and Paciorek 2017 | U.S. | Bunching around CLL | [1.5, 2] |
| Adelino, Schoar, and Severino 2020 | U.S. | Diff in diff around CLL | [1.3, 5.3] |
| Davis, Oliner, Peter, Pinto 2020 | U.S. | Cut in FHA insurance premium | 3.4 |
| Fuster and Zafar 2021 | U.S. | Consumer survey | 2.5 |
Notes: This table summarizes the literature on the relationship between house prices and interest rates. The “macro papers” panel summarizes five papers from the large literature using macroeconomic data. The second panel reviews four papers based on microeconomic data. The “U.S./International” column reports whether the study is based on U.S. or international data. The “Method” column reports the identification strategy. “CLL” stands for conforming loan limit. The last column reports the estimated effect on house prices after a 1 percentage point interest rate shock. For macro papers, these effects are 10 quarters after a 1 percentage point monetary policy shock. For the micro papers, the effects are for a 1 percentage point shock in the mortgage rate.
One difference between the macro and the micro literatures is in the measure of interest rate used. Macro papers tend to study monetary policy shocks or shocks to long term rates, either nominal or real. Micro studies often focus on mortgage rate shocks using arguably exogenous cutoffs at mortgage origination. For example, one such cutoff is the conforming loan limit (CLL). Most mortgages that are smaller than the CLL are guaranteed by Fannie Mae or Freddie Mac, enjoying lower interest rates than loans that are larger than the CLL, also known as jumbo loans. By looking at house prices around this exogenous cutoff and how they change when the CLL increases, Adelino, Schoar, and Severino (2020) find a semi-elasticity between -5.3 and -1.3.
Rather than using mortgage and house price data, Fuster and Zafar (2021) use the housing module of the New York Fed Survey of Consumer Expectations to elicit how much survey respondents are willing to pay for the same house in two hypothetical scenarios: when the mortgage rate is 4.5 percent or 6.5 percent. They find that even a 2-percentage point increase in the mortgage rate only lowers borrowers’ willingness to pay by 5 percent.
Conclusion
The semi-elasticity of house prices to interest rates implied by the theoretical user cost model suggests that the decline in mortgage rates during the pandemic can quantitatively account for the national house price boom. But our empirical estimates and prior studies suggest that the decline in mortgage rates can only explain low single-digit house price increases. Instead, we find that housing activity, both sales and construction, are very sensitive to interest rates.

Haoyang Liu is an economist in the Federal Reserve Bank of New York’s Research and Statistics Group.

David Lucca is a vice president in the Bank’s Research and Statistics Group.

Dean Parker is a senior research analyst in the Bank’s Research and Statistics Group.

Gabriela Rays-Wahba is a senior research analyst in the Bank’s Research and Statistics Group.
How to cite this post:
Haoyang Liu, David Lucca, Dean Parker, and Gabriela Rays-Wahba, “The Housing Boom and the Decline in Mortgage Rates,” Federal Reserve Bank of New York Liberty Street Economics, September 7, 2021, https://libertystreeteconomics.newyorkfed.org/2021/09/the-housing-boom-and-the-decline-in-mortgage-rates.
Disclaimer
The views expressed in this post are those of the authors and do not necessarily reflect the position of the Federal Reserve Bank of New York or the Federal Reserve System. Any errors or omissions are the responsibility of the authors.
 RSS Feed
 Follow Liberty Street Economics