A Liberty Street Economics post from last summer by Matthew Higgins and Thomas Klitgaard contained an assessment of the Phase One trade agreement between the United States and China. The authors of that note found that, depending on how successfully the deal was implemented, the impact on U.S. economic growth could have been substantially larger than originally foreseen by many of its critics, as a result of the fact that the pandemic had depressed the U.S. economy far below its potential growth path. Here we take another look at these considerations with the benefit of an additional year’s worth of trade data and a much different economic environment in the United States.
Is China Meeting Its Phase One Trade Commitments?
The Phase One trade agreement that was signed in January 2020 included specific targets for Chinese purchases of agriculture, manufactured goods, energy, and service exports from the United States (these were laid out in Chapter 6 and Annex 6.1 of the agreement). These commitments were extremely ambitious: The agreement specified numerical targets for increases in U.S. goods and services exports to China, relative to a 2017 baseline, of $77 billion in 2020 and $123 billion in 2021. The 2021 target was 82 percent greater than the baseline level in 2017, and about double the level of 2019, just prior to the signing of the agreement.
The U.S.’s exports of goods to China fell precipitously over the course of the trade conflict, ultimately contracting by 35 percent as of February of last year, but since then have shown a strong recovery. From that low point, exports to China had grown by nearly 70 percent as of June. So, is China meeting its purchase targets? As suggested in the table below, the short answer is “no.”
Merchandise Trade Has Substantially Missed Targets That Were Set Under the Phase One Trade Deal
| U.S. exports to China | ||||||||
|---|---|---|---|---|---|---|---|---|
| (Billions of U.S. dollars) | Target | Target | ||||||
| 2017 (Baseline) | 2018 | 2019 | 2020 (Actual) | 2021 (12m rolling sum as of July) | 2020 | 2021 | ||
| Total goods targeted | 95 | 85 | 78 | 93 | 114 | 159 | 193 | |
| Manufactures | 67 | 67 | 60 | 56 | 65 | 99 | 111 | |
| Agricultural | 21 | 10 | 15 | 27 | 36 | 33 | 40 | |
| Energy | 8 | 8 | 4 | 10 | 14 | 26 | 42 | |
| Total goods not targeted* | 35 | 35 | 29 | 31 | 35 | 33 | 33 | |
| Services** | 55 | 57 | 57 | 40 | 36 | 68 | 80 | |
| Total goods and services | 185 | 177 | 163 | 165 | 184 | 260 | 306 |
* “Not targeted” 2020 and 2021 projections assume constant 2017-2019 average level.
**Services column for 2021 shows seasonally adjusted data for Q1 and Q2 at an annual rate.
Even so, some of the details show more positive developments. The category closest to meeting the targets is agriculture, in which exports to China are booming and have well surpassed 2017 levels and approximately doubled from 2019. In this area China fell within 80 percent of the 2020 target and appears on track to perform similarly this year. These exports have benefited from higher agriculture prices as well as strong demand for feed from China’s livestock industry, which is recovering from a devastating swine flu epidemic in 2019.
Progress under manufactured goods, energy, and services has been modest at best, however. Manufactured goods exports to China remain below 2017 levels and currently are running at somewhat over half of the 2021 target. (The figures in the table include certain aircraft products that were not included in the post from last year). Energy exports have nearly doubled from their 2017 level, helped by sharply higher prices, but ended 2020 about 60 percent below target and are currently about two-thirds below the 2021 target. Finally, service exports have simply collapsed, with the most recent data in the first half of 2021 (at an annual rate) one-third below the 2017 level and less than one-half of the 2021 target.
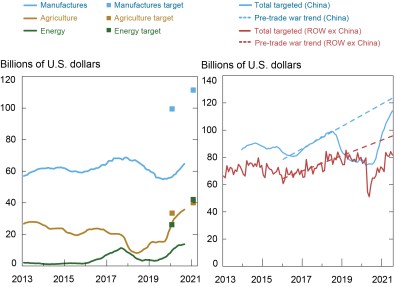
The chart below put these figures into a longer time perspective. The left panel shows that U.S. exports to China of manufactured and energy goods are little changed from historical levels: the rebound that began last year has basically been making up ground that was lost during the trade conflict. By contrast, agricultural goods have rebounded to well-above historical norms. At this point it remains too early to know whether these gains will be sustained, however. The right panel of the chart compares total goods exports to China that are targeted in the Phase One agreement with the same set of goods to the rest of the world except for China (which are not subject to any targets). The goods to China experienced a significant decline during the trade conflict that was not mirrored in the rest of the world data. Now, both sets of data have recovered strongly, with China’s growth faster thanks to strong agriculture exports, but the level of U.S. exports for both sets of data remain below the pre-trade conflict trend lines.
U.S. Exports of Specified Goods Have Increased, But Are Well Below Target

What Has Been the Impact on the U.S. Merchandise Trade Balance?
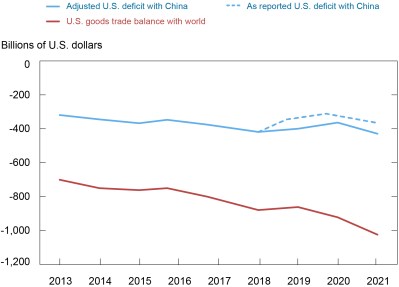
A broad goal of the Phase One agreement was to reduce the U.S. merchandise trade deficit. As many analysts had foreseen, imposition of tariffs against China and other countries, as well as the purchase commitments in the Phase One deal, had little durable effect on the U.S.’s trade deficit. As shown in the red line in the chart below, the U.S.’s trade deficit with the world increased notwithstanding the many tariffs that were imposed on China and other countries. Even with China itself, the impact on the trade balance was not large. As shown in the dotted blue line in the chart below, the reported deficit with China did shrink somewhat. But that decline was exaggerated as a result of underreporting of U.S. import data to avoid import tariffs (perhaps as much as $55 billion). After making an adjustment for this underreporting of imports, the decrease in the trade deficit was quite small, and it had already surpassed 2018 levels by this June.
The U.S. Trade Deficit Increased During Trade Conflict

Reconsidering the Phase One Deal in Light of the U.S. Recovery
So, with this data as background, what should we make of the Phase One deal? The authors of last summer’s blog argued that, because the United States was operating so far below its growth potential as a result of the pandemic, an exogenous increase in demand from China would likely have a larger impact than most economists had expected when the agreement was signed.
How do these arguments hold up now? The authors of the previous post discussed the issues of trade creation versus trade diversion and commodity market feedbacks: There would be no effect on U.S. growth if the “extra” exports to China were simply offset by decreased exports to other countries or by lower sales into the U.S. market, which could induce increased imports from other countries. The benefit to U.S. commodity producers would also be dampened if Chinese demand of U.S. energy products induced increases in supply from other producers, which would lower prices.
Thus far such factors do not appear evident in the data. Although it is true that exports to China have grown faster than to the rest of the world, most U.S. trade partners have been slow to recover from the pandemic, and this is probably the main reason exports of covered goods have been rather more subdued than to China. Moreover, commodity prices have risen substantially to the benefit of U.S. commodity exporters. Finally, increases in exports to China probably have been too small thus far to induce trade diversion or commodity supply effects. In fact, agriculture exports to China of major producers in Latin America are doing well, albeit not growing as strongly as the United States.
However, U.S. economic conditions have changed quite dramatically over the past year in ways that suggest that the growth multiplier from increased Chinese demand may be much lower than what the previous Liberty Street post proposed. The “multiplier” refers to the extra amount that GDP may increase in response to an initial increase in demand, incorporating secondary responses on both the demand- and supply-sides of the economy. Both theory and empirical evidence indicate that multipliers can be considerably greater than one during recessions (around 1.5 to 2.0) than during expansions (less than 0.5). For a point of reference, the incremental demand implied by China’s 2021 goods and service purchase commitments totaled 0.6 percent of U.S. GDP.
During the depths of the pandemic there were strong reasons to believe that this multiplier would be considerably higher than one. However, the economic picture is much different now. GDP growth is strong, inflation is rising, and employment is recovering, all boosted by expansionary fiscal and monetary policies. Moreover, financial markets and professional forecasters are already debating the timing and extent of an eventual shift to less accommodative economic policies. Against such a backdrop, it no longer seems likely that China’s purchase commitments—even if they were met—would have a GDP multiplier greater than one (and probably considerably less).
So, if the economic impact of the purchase commitments is not likely to be large, is the Phase One agreement unimportant? We argue that it would be a mistake to simply dismiss the agreement.
The Phase One agreement covered a range of substantive issues in Chapters 1 through 5 that deserve more attention than the purchase targets in Chapter 6. These included enhanced protections for intellectual property and technology transfer; removal of non-tariff barriers and other unfair trade practices in agriculture and financial services; and greater flexibility and transparency in China’s exchange rate regime, all with the intent to level the playing field between China and its trading partners. The set of concerns reflected in these chapters are particularly salient given the large and arguably growing role of the Chinese government in ownership and control of the country’s economy and financial system (for example, as outlined in the most recent 14th Five-Year Plan). Against this backdrop the U.S. economy could experience considerable long-term benefits from close enforcement of commitments under the first five chapters of the agreement.

Hunter L. Clark is an assistant vice president in the Federal Reserve Bank of New York’s Research and Statistics Group.
How to cite this post:
Hunter L. Clark, “An Update on the U.S. – China Phase One Trade Deal,” Federal Reserve Bank of New York Liberty Street Economics, October 6, 2021, https://libertystreeteconomics.newyorkfed.org/2021/10/an-update-on-the-us-china-phase-one-trade-deal.html.
Disclaimer
The views expressed in this post are those of the author and do not necessarily reflect the position of the Federal Reserve Bank of New York or the Federal Reserve System. Any errors or omissions are the responsibility of the authors.


 RSS Feed
 Follow Liberty Street Economics