


Today we are launching a Regional Employment web interactive that gives users a convenient place to measure and analyze employment trends in the Federal Reserve’s Second District. The interactive features the New York Fed’s early benchmarked regional employment data, which anticipate revisions that are made to official preliminary data released by the Bureau of Labor Statistics at a later date, and so tend to track employment trends more closely than initial monthly releases. The new interactive illustrates employment trends for more than twenty geographies in the region, including states and metropolitan areas, from the year 2000 to the latest available month.
The data can be visualized either in employment levels or as an index of job growth, allowing users to customize the charts based on the areas and time frame of interest. Hovering on a data point reveals the value for that particular month. Users can choose up to six regions to compare, and the data set’s history can be downloaded.
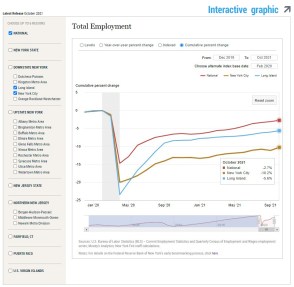
The indexing feature is helpful for understanding labor market trends over a particular period of time and for comparing among areas. For example, the interactive allows users to easily measure and display the employment decline during the pandemic, as well as current job shortfalls—data we analyzed for our recent press briefing on the region’s economic recovery. For example, the interactive shows that employment in Long Island still trails its pre-pandemic level by 5.6 percent (see the chart below). We also provide data for the United States to help users see how a specific region’s employment trend compares with the nation as a whole.
The interactive reports state- and territory-level data for New York, New Jersey, Puerto Rico, and the U.S. Virgin Islands. Geographical subregions include Upstate and Downstate New York, Northern New Jersey, and Fairfield County, Connecticut, as well as metropolitan areas throughout the New York-Northern New Jersey region. Charts will be updated on a monthly basis as the data that are used for our benchmarking process become available, typically in the second half of each month.
This interactive complements our range of Regional Data products, including charts measuring the spread of COVID-19 in the region, economic profiles of local areas, and the New York Fed’s monthly Empire State Manufacturing and Business Leaders surveys, as well as special surveys of regional manufacturing and service firms. We hope readers find these resources valuable for monitoring economic trends in their local areas.

Jaison R. Abel is an assistant vice president in the Federal Reserve Bank of New York’s Research and Statistics Group.

Jason Bram is a research officer in the Bank’s Research and Statistics Group.

Richard Deitz is an assistant vice president in the Bank’s Research and Statistics Group.

Jonathan Hastings is a research associate in the Bank’s Research and Statistics Group.
Disclaimer
The views expressed in this post are those of the authors and do not necessarily reflect the position of the Federal Reserve Bank of New York or the Federal Reserve System. Any errors or omissions are the responsibility of the authors.
 RSS Feed
 Follow Liberty Street Economics