


U.S. inflation has surged as the economy recovers from the COVID-19 recession. This phenomenon has not been confined to the U.S. economy, as similar inflationary pressures have emerged in other advanced economies albeit not with the same intensity. In this post, we draw from the current international experiences to provide an assessment of the drivers of U.S. inflation. In particular, we exploit the link among different measures of inflation at the country level and a number of global supply side variables to uncover which common cross-country forces have been driving observed inflation. Our main finding is that global supply factors are very strongly associated with recent producer price index (PPI) inflation across countries, as well as with consumer price index (CPI) goods inflation, both historically and during the recent bout of inflation acceleration.
Background
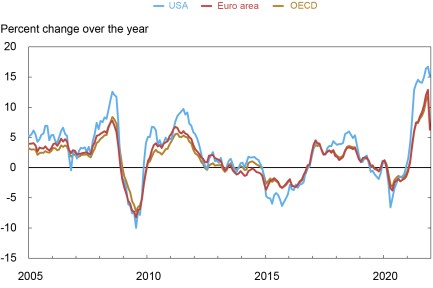
The chart below shows the evolution of PPI inflation for the United States, the euro area, and the OECD countries since 2005. As one can see, changes in U.S. PPI inflation are highly correlated with movements of the corresponding series in the euro area and the OECD.
U.S. PPI Inflation Is Highly Correlated with Euro Area and OECD PPI Inflation
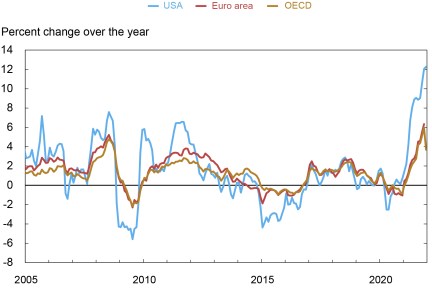
A similar pattern holds for goods CPI inflation, as shown in the chart below. In particular, all major advanced countries have experienced a large rise in goods inflation during the pandemic recovery period. At the services level, however, inflation across countries has been more muted to date. More specifically, services CPI inflation in the United States rose from 1.3 percent in January 2021 to 4.0 percent in December. In comparison, CPI services inflation increased to 2.4 percent from 1.4 percent in the euro area, and to 2.9 percent from 1.0 percent in the OECD (excluding the United States) over the same period.
U.S. Goods CPI Inflation Is Highly Correlated with Euro Area and OECD Goods CPI Inflation
Developments on the supply side of economies are often highly correlated across countries. We postulate that global proxies for these supply side developments capture key determinants of selected measures of inflation across countries. One global supply side factor is our newly constructed Global Supply Chain Pressure Index (GSCPI), a gauge of disruption in global supply chains as we discussed in detail in our companion post. Another key potential global supply side variable is the price of energy, for which we focus on oil, and back out factors that explain oil price fluctuations in terms of a global demand factor and an oil supply factor. A recent application of this methodology can be found in Groen and Noble (2021) and it is updated weekly for the Federal Reserve Bank of New York Oil Price Dynamics Report. More specifically, using a statistical model and a large number of financial variables, weekly oil price changes are decomposed into demand effects, supply effects, and an unexplained residual.
Some Historical Contemporaneous Relationships
We next formally quantify the contemporaneous correlations between different measures of inflation for the United States and major advanced economies and our global factors using monthly data from 1997 to 2021. We take the euro area as the representative “country” for inflation developments in major advanced economies outside the United States. Our methodology exploits linear regressions that relate the different measures of year-on-year inflation rates country-by-country with our new GSCPI measure, as well as our estimates of global oil supply and demand factors behind year-on-year oil price changes. This approach yields the average monthly correlations between the country-by-country inflation measures and our global variables for a sample of data going back to 1997.
While we do not report the estimated coefficients here, three key results are worth highlighting from our analyses. First, changes in the global supply chain pressure index (GSCPI) have had a meaningful impact on PPI and goods CPI inflation for the 1997-2021 period, both for the U.S. and the euro area. Second, the oil supply factor plays a larger role in driving the overall fit of the regressions compared to the other two explanatory variables across the advanced economies. Third, our set of global variables appear to be unrelated to movements in services CPI inflation for the countries considered in our analyses.
We next use the estimated regression relationships to explore how the three global variables have correlated with recent inflation developments. We do so by first re-running the regressions only using data until 2019. We then use the regression estimated along with the observed values of the GSCPI and global oil demand and supply factors since the beginning of 2020 to calculate the implied cross-country inflation rates.
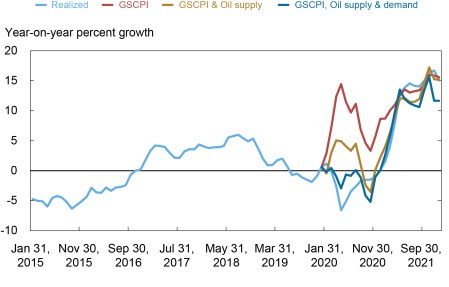
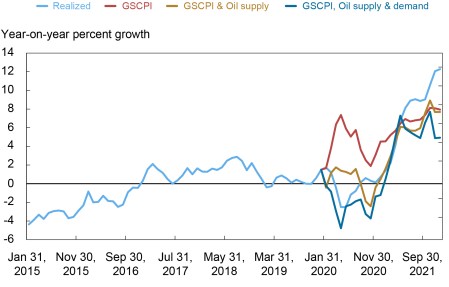
We begin by discussing the results for PPI inflation. Note that as it has been shown in our companion blog post, the pandemic related events of 2020-2021 resulted in a doubling of the volatility of changes in the GSCPI, as well as increased volatility of shocks to oil price changes by about 50 percent. The chart below shows the relationship between the recently more volatile global factors and PPI inflation in the U.S. More specifically, in the chart we include estimates based on three models: (1) with only the GSCPI (the red line), (2) with the GSCPI and the oil supply factor (the yellow line), and (3) with the GSCPI and both oil supply and demand factors (the dark blue line). The latter is in line with the regressions we previously ran on the whole 1997-2021 sample to assess the historical correlations between inflation and our global variables.
The chart clearly illustrates that our model based solely on global supply factors (the dark blue line) tracks observed U.S. PPI inflation (the light blue line) in the recent part of the sample quite well, implying that there does not appear to be a structural break between the association of PPI inflation and the explanatory variables. As such, if global supply chain bottlenecks and energy price increases do not remain persistently high, we may expect to see decreasing pressure on inflation going forward. It is also important to note that including the oil demand factor helped the model to capture the downturn in PPI inflation at the outset of the pandemic.
Global Supply Factors Are Related to the Recent Surge in PPI in the U.S.
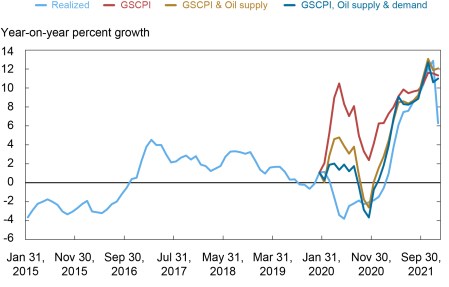
The chart below graphs the contributions of our three global factors to the fluctuations in recent PPI inflation in the euro area. As was the case for the U.S., the supply side factors (the dark blue line) are instrumental in explaining the observed PPI inflation for the euro area, especially during the recovery period. Differently from the United States, however, demand-based oil price increases did not have much impact on euro area PPI inflation, neither in the beginning of the COVID-19 pandemic nor more recently during the recovery period.
Global Supply Factors Are Related to the Recent Surge in PPI in the Euro Area
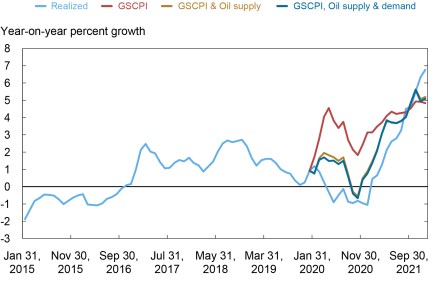
We next turn our attention to goods CPI inflation. The two charts below show our results for goods CPI inflation in the United States and the euro area, respectively, where we include estimates based on the same three models as done before for PPI inflation. These charts clearly illustrate that global supply factors have played a substantial role in driving observed goods CPI inflation rates in the two regions (the light blue lines) in the recent part of the sample even though they do not fully capture all observed CPI goods inflation moves. This is not surprising given that a multitude of factors may drive a wedge between producer and retail pricing. Finally, as was the case with PPI inflation, there does not appear to be a structural break in the association of goods CPI inflation rates and the explanatory variables, as the dark blue lines track the light blue lines well.
The first chart below depicts the implied relationship for U.S. goods CPI inflation. Here it is important to note that including only the GSCPI gives a good picture of the path of inflation during the recovery period (the red line) while it is less successful in its association with goods CPI inflation at the onset of the pandemic. Indeed, including the oil demand factor is key in capturing the downturn in U.S. goods CPI inflation at the outset of the crisis.
Global Supply Factors Are Related to Recent U.S. CPI Goods Inflation
The final chart reports the results of a similar exercise for the euro area. Here, a similar mix of global supply factors developments can describe euro area goods CPI inflation since 2020. However, supply-driven oil price hikes appear to be a key driver for the euro area. In contrast to the United States, demand-based oil price increases have had virtually no impact on euro area goods CPI inflation during the 2020-2021 period.
Global Supply Factors Are Also Related to Recent Euro Area Goods CPI Inflation
Conclusion
Our analysis emphasizes that global supply factors related to supply chain disruptions and energy markets are associated with recent developments in key measures of inflation across advanced economies.
The persistence of recent inflationary pressures at the goods CPI and PPI levels are importantly related to the evolution of global supply factors such as production or shipping bottlenecks and input prices: their global nature and their source (that is, supply as opposed to demand) suggest that domestic monetary policy actions would have only a limited effect on these sources of inflationary pressures.
An important caveat of our analysis is that our results are based on contemporaneous correlations and abstract from dynamic considerations that might be important in capturing a lagged responses of services CPI inflation. Supply factors could indeed feed into services over time rather than simultaneously as for goods prices. Given the relatively short time period (that is, from the beginning of the pandemic) over which we can evaluate our empirical specification we defer this analysis for further work.
Chart data ![]()

Ozge Akinci is a senior economist in the Federal Reserve Bank of New York’s Research and Statistics Group.

Gianluca Benigno is an assistant vice president in the Bank’s Research and Statistics Group.

Ruth Cesar Heymann is a senior research analyst in the Bank’s Research and Statistics Group.

Julian di Giovanni is an assistant vice president in the Bank’s Research and Statistics Group.

Jan J. J. Groen is an officer in the Bank’s Research and Statistics Group.

Adam I. Noble is a senior research analyst in the Bank’s Research and Statistics Group.

Lawrence Lin is a senior research analyst in the Bank’s Research and Statistics Group.
Disclaimer
The views expressed in this post are those of the authors and do not necessarily reflect the position of the Federal Reserve Bank of New York, the Federal Reserve Board, or the Federal Reserve System. Any errors or omissions are the responsibility of the authors.
 RSS Feed
 Follow Liberty Street Economics