


The economic recovery from the COVID-19 pandemic has been uneven across countries and sectors. While U.S. imports have rebounded to surpass their level before the collapse in 2020, U.S. exports remain far below their pre-pandemic level. This asymmetry in part reflects the different sectoral compositions of imports and exports. U.S. imports are driven by goods trade, while exports rely more heavily on services trade. A key component of services exports is foreign travel to the United States, which has dried up due to the suspension of nonessential travel imposed in March 2020. However, U.S. exports may now be at a turning point given the reopening of U.S. borders to all vaccinated travelers on November 8. We analyze the trajectory of U.S. services and how the lifting of the travel ban might contribute to the rebound of U.S. services exports.
Trade Dynamics since the Onset of the Pandemic
U.S. trade collapsed at the onset of the COVID-19 pandemic. Export and import volumes fell by 67 percent and 59 percent, respectively, in the second quarter of 2020. This collapse was uniform across goods and services trade. However, as the charts below show, the rebound in trade has been asymmetric across sectors, and has had a particularly large impact on the recovery of U.S. exports. While services only make up 20 percent of U.S. imports, they account for one-third of total exports. It is not surprising, then, that goods-intensive imports have recovered at a faster rate than exports, given the shutdown of the service sector, both domestically and abroad, along with the effects of border closures.
U.S. Exports Have Lagged Behind Imports
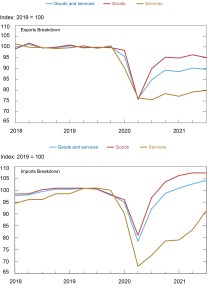
Source: Bureau of Economic Analysis, accessed through Haver Analytics.
The Role of Foreign Travel in Exports
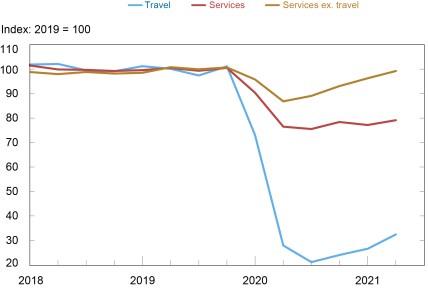
The travel and transport subcategories of exports represent 23 percent and 10 percent, respectively, of total service exports. Activity in these subcategories fell by more than 90 percent in the beginning of 2020 and has yet to recover, thus placing a substantial drag on services exports.
The chart below makes clear the importance of foreign travel to the United States. The blue line plots the evolution of travel exports and the red line traces total exports of services. Both lines turn down significantly at the onset of the pandemic, though the total services decline was not as severe as the travel sector decline given that other subcategories performed better than the travel sector (for example, exports of financial services) at that time. As can be seen, if this scenario had materialized, services exports would have almost returned to their pre-pandemic level by the second quarter of 2021. Given these relationships, we next ask how U.S. exports may recover as foreigners begin to visit the United States for business or leisure.
A Drop in Travel Abroad Pulled down U.S. Services Exports
International Visitors and U.S. Exports
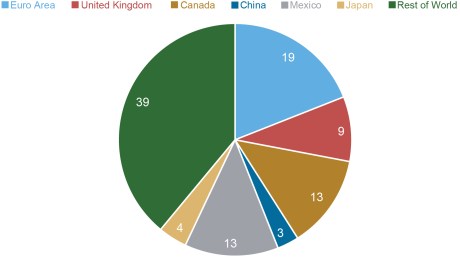
The chart below breaks down the shares of international travelers entering the United States in 2019 by region. Using data from the Bureau of Transportation Statistics on incoming flights, we are able to pinpoint passengers’ countries of origin. Of the 30 million travelers that visited the United States that year, 19 percent came from Europe, with Mexico and Canada each accounting for 13 percent, the United Kingdom for 9 percent, Japan for 4 percent, and China for 3 percent. Once the U.S. enforced a travel ban on all countries in March 2020, passenger headcount dropped by 98 percent year over year to 771,000 passengers in the second quarter of 2020.
The Largest Share of U.S.-Bound Tourists Are from Europe
As passenger volumes plummeted, nominal export travel services dropped from $50 billion to $13 billion, a 72 percent decline. As the chart below shows, this fall in passenger travel mapped one-to-one to the fall in export travel. More generally, by employing simple regression analysis over a twenty-year sample prior to the pandemic, we find that a 1 percentage point change in total annual passenger growth corresponds to a 1 percentage point change in annual travel export growth.
The Number of Passengers Entering the United States and the Volume of Travel Exports Move Together
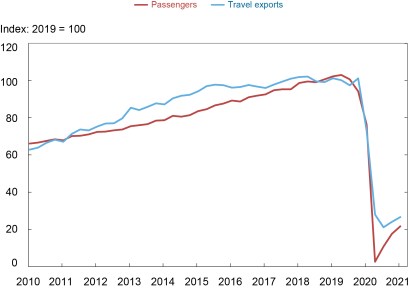
Sources: Bureau of Economic Analysis; Bureau of Transportation Statistics.
How Fast Could Exports Take Off and What Does This Imply for GDP Growth?
We next ask what the implied boost to U.S. services exports would be if the number of incoming passengers returns to pre-pandemic levels. To perform this exercise, we assume that service exports excluding travel and transport remain on their current trend and use the one-to-one relationship between passenger growth and travel export growth to infer the growth rate of travel and transport exports.
Assuming that passenger travel fully recovers to its pre-pandemic path in 2022, total real services exports would reach $794 billion (annualized) in Q4 2022. This is around $150 billion higher than if growth continued at the pace set in the first three quarters of 2021.
One important caveat of this study is that all passengers are treated equally in terms of dollars spent while visiting. There is not enough data available to evaluate how this relationship may vary by country of origin. However, information from the Office of New York, which reports the spending of tourists by country of origin, suggests that substantial differences exist. For example, the Office’s estimates imply that Chinese visitors spend on average $3,008 dollars per visit to New York City. In contrast, the Office find that tourists visiting from Italy, Germany, France, and the United Kingdom spend between $1,200 and $1,500 dollars per visit. Therefore, heterogeneity in passengers will play an important role in the recovery of travel exports given that vaccination rates, policies on foreign travel, and spending propensities vary across countries.
Setting this caveat aside, a full recovery of tourism and foreign business travel to the United States would contribute 0.5 percent per quarter to annualized GDP growth by the end of 2022, offsetting the drag that services exports have been on the economy during the pandemic.
This analysis comes with the additional caveat that a variant of COVID-19, such as Omicron, could delay the rebound envisioned in the baseline scenario presented in this post.
Ruth Cesar Heymann is a senior research analyst in the Federal Reserve Bank of New York’s Research and Statistics Group.

Julian di Giovanni is an assistant vice president in the Bank’s Research and Statistics Group.
How to cite:
Ruth Cesar Heymann and Julian di Giovanni, “When Will U.S. Exports Take Off?,” Federal Reserve Bank of New York Liberty Street Economics, January 3, 2022, https://libertystreeteconomics.newyorkfed.org/2022/01/when-will-us-exports-take-off/.
Disclaimer
The views expressed in this post are those of the authors and do not necessarily reflect the position of the Federal Reserve Bank of New York or the Federal Reserve System. Any errors or omissions are the responsibility of the authors.
 RSS Feed
 Follow Liberty Street Economics