


Editors’ note: When this post was first published the x-axis labels on the final chart were incorrect. The chart has been corrected. 9:10 a.m. ET, July 6.

Prior research has shown that many small and minority-owned businesses failed to receive Paycheck Protection Program (PPP) loans in 2020. To increase program uptake to underserved firms, several changes were made to the PPP in 2021. Using data from the Federal Reserve Banks’ 2021 Small Business Credit Survey, we argue that these changes were effective in improving program access for nonemployer firms (that is, businesses with no employees other than the owner(s)). The changes may also have encouraged more applications from minority-owned firms, but they do not appear to have reduced disparities in approval rates between white- and minority-owned firms.
Changes in the Paycheck Protection Program in 2021
Critics have cited various reasons for underserved firms’ lack of access to PPP funds. Some have faulted the intermediated nature of the program, and the resulting incentives for banks to prioritize existing borrowers as well as larger firms in their approval processes. Others have argued that certain program rules—especially the requirement that nonemployer firms calculate eligible loan amounts using net profit (rather than gross income)—were especially disadvantageous to the smallest firms. Nonemployer firms also had delayed access to PPP at the onset of the program. For nonemployers and other small firms, a lack of program awareness and concerns about eligibility for the loan and subsequent forgiveness likely acted as barriers to program take-up. Finally, racial discrimination faced by some applicants for PPP loans may also have played a part.
In response to evidence of underserved firms’ lack of access to PPP, Congress and the Small Business Administration (SBA) implemented several important changes prior to the 2021 round of PPP. As part of the Economic Aid Act of 2020, Congress pre-allocated large amounts of PPP funds for businesses located in low- and moderate-income communities, those with at most ten employees, and first-time PPP borrowers. The bill also set aside funds for lenders who typically provide credit to underserved borrowers, such as Community Development Financial Institutions (CDFIs), Minority Depository Institutions (MDIs), small banks, and credit unions. To effectively implement these and other changes, the SBA instituted a two-day exclusivity window at the very start of the 2021 program during which only Community Financial Institutions (CFIs) were permitted to submit applications to the SBA.
To further increase access to PPP funds, the SBA and the Biden administration announced additional changes in late February. The most important of these were: (i) an exclusive, fourteen-day borrowing window for firms with at most twenty employees; and (ii) allowing nonemployer firms to base loan amount calculations on gross income.
PPP Application Take-up in 2021
Were these initiatives effective in increasing application take-up by nonemployer firms and small employer firms? The SBA’s PPP reports indicate a clear increase in funding for smaller businesses in the 2021 phase of the PPP. However, it remains unclear whether this increased take-up is driven primarily by changes in application behavior or by changes in approval rates. Furthermore, almost 71 percent of PPP borrowers chose not to report race/ethnicity information on their PPP applications, making it difficult to draw conclusions about PPP access for minority-owned businesses. To resolve these issues, we turn to data from the Federal Reserve’s 2021 Small Business Credit Survey, which contains detailed demographic information about the owners of small businesses.
In the chart below, we examine nonemployer application rates from 2020 and 2021, relative to the analogous rates for firms with employees on payroll. Application rates were lower across the board in 2021 than in 2020, but there was a much smaller drop for nonemployer firms than for any other size class of firms. Moreover, 36 percent of 2021 nonemployer applicants were first-time PPP applicants, compared to just 12 percent of 2021 employer applicants. Thus, the program changes appear to have increased application take-up by nonemployer firms, with the caveat that employer firms may have had a larger drop in demand for PPP funds between 2020 and 2021 than did nonemployer firms.
PPP Application Rates by Firm Size
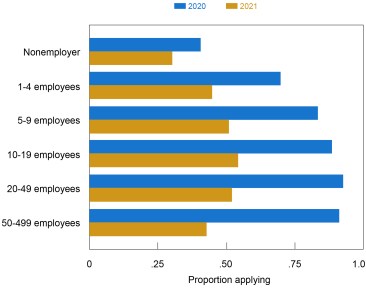
Notes: Fielded September-November 2021. For respondents in each size group (where size is determined by number of full- and part-time employees), the blue bars show the fraction of respondents who reported applying for a PPP loan in 2020. Similarly, the gold bars show the fraction of respondents who reported applying for a PPP loan in 2021. Responses by nonemployer (employer) firms are weighted on a variety of firm characteristics in order to match the national population of nonemployer (employer) firms. See the methodology section of the 2022 Report on Employer Firms for more information.
The chart also suggests that initiatives targeted toward small employer firms had mixed effects. We do not observe a clear effect of the fourteen-day exclusivity period for firms with at most 20 employees, as application rates for firms with 1-19 employees and with at least 20 employees feature similar declines. However, the pre-allocated funding for firms with at most 10 employees may have encouraged firms to apply: 19 percent and 8 percent of firms with 1-4 and 5-9 employees, respectively, were first-time applicants in 2021, compared to just 6 percent and 2 percent for firms with 10-19 and at least 20 employees, respectively.
PPP Application Take-up by Race and Ethnicity
We next study changes in PPP application rates by owner race/ethnicity from 2020 to 2021. In the following chart, we observe noticeably smaller decreases in application rates for Black- and Hispanic-owned businesses than for white-owned businesses. Indeed, the application rate for Black-owned businesses exceeded that of white-owned firms in 2021. Furthermore, we find that 33 percent and 30 percent of Black- and Hispanic-owned employer firms applying in 2021, respectively, were first-time borrowers, relative to just 11 percent of white-owned employer firms.
PPP Application Rates by Race/Ethnicity
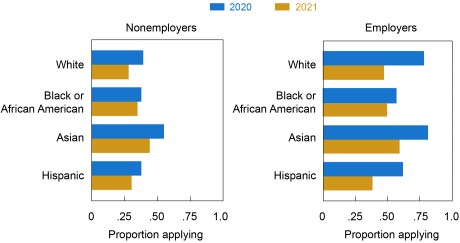
Notes: Fielded September-November 2021. For respondents in each Race/Ethnicity category, the blue bars show the fraction of respondents who reported applying for a PPP loan in 2020. Similarly, the gold bars show the fraction of respondents who reported applying for a PPP loan in 2021. Race/ethnicity categories are mutually exclusive. Responses by nonemployer (employer) firms are weighted on a variety of firm characteristics in order to match the national population of nonemployer (employer) firms. See the methodology section of the 2022 Report on Employer Firms for more information.
PPP Approvals in 2021
Did the 2021 initiatives alleviate gaps in approval rates documented for the 2020 phase of the program? In the chart below, we plot the fraction of PPP applicants in each size category that successfully obtained at least some PPP funding. Nonemployer firms are the only category for which the 2021 approval rate was higher than the 2020 approval rate. In contrast, approval rates across all other groups were slightly lower in 2021 than in 2020. This suggests that, at least for employer firms, changes made to the PPP in 2021 did not improve the success of applications.
PPP Approval Rates by Firm Size
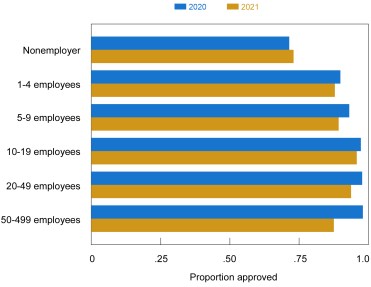
Notes: Fielded September-November 2021. For respondents in each size group (where size is determined by number of full- and part-time employees), the blue bars show the fraction of 2020 PPP applicants who reported receiving a PPP loan in 2020. Similarly, the gold bars show the fraction of 2021 PPP applicants who reported receiving a PPP loan in 2021. Responses by nonemployer (employer) firms are weighted on a variety of firm characteristics in order to match the national population of nonemployer (employer) firms. See the methodology section of the 2022 Report on Employer Firms for more information.
Which changes may have had uniquely positive, albeit small, effects on approval outcomes for nonemployer firms? The guidance allowing nonemployer firms to calculate loan amounts using gross income rather than net profit likely played a large role in increasing approval rates. Additionally, nonemployer firms applying for PPP in 2021 were more likely than employer firms to be applying for first-draw loans, which did not require attestation and supporting documentation of at least a 25 percent drop in revenues in at least one quarter of 2020 (relative to the same quarter in 2019). News articles have documented additional obstacles to getting second-draw loans (for example, applications stalled when first-draw loans were flagged by the SBA’s internal review of the 2020 program) that may have disproportionately impacted employer firms.
PPP Approvals in 2021 by Race and Ethnicity
Our final chart plots 2020 and 2021 approval rates by owner race/ethnicity. Within-group approval rates are generally similar between 2020 and 2021, further supporting the idea that determinants of PPP approval outcomes were largely unaffected by the 2021 changes to the PPP. An important exception is an almost 9 percent drop (from 74.1 percent to 65.4 percent) in approval rates for Black-owned employer firms from 2020 to 2021. This exception is consistent with the relatively strong take-up of PPP applications by Black-owned employer firms in that more underserved firms may have been less likely to apply successfully for PPP funds.
PPP Approval Rates by Race/Ethnicity
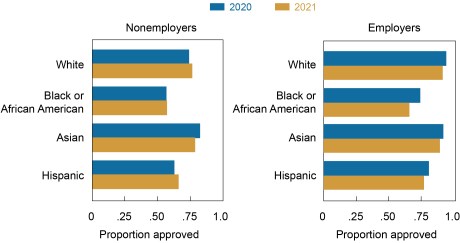
Notes: Fielded September-November 2021. For respondents in each race/ethnicity category, the blue bars show the fraction of 2020 PPP applicants who reported receiving a PPP loan in 2020. Similarly, the gold bars show the fraction of 2021 PPP applicants who reported receiving a PPP loan in 2021. Race/ethnicity categories are mutually exclusive. Responses by nonemployer (employer) firms weighted on a variety of firm characteristics in order to match the national population of nonemployer (employer) firms. See the methodology section of the 2022 Report on Employer Firms for more information.
Final Words
Our findings suggest that changes made to the PPP in 2021 succeeded in increasing credit access for nonemployer firms. For minority-owned firms, these initiatives appear to have improved application take-up, particularly for Black-owned employer firms. However, approval rate gaps between white-owned and Black-/Hispanic-owned firms were not attenuated. Understanding the causes of persistent gaps in PPP approvals between employer and nonemployer firms, as well as between white- and minority-owned firms, remains an important avenue for future research.

Nathan Kaplan is a research analyst in Money and Payment Studies in the Federal Reserve Bank of New York’s Research and Statistics Group.

Claire Kramer Mills is a manager and director of community development analysis in the Bank’s Communications and Outreach Group.

Asani Sarkar is a financial research advisor in Non-Bank Financial Institution Studies in the Federal Reserve Bank of New York’s Research and Statistics Group.
How to cite this post:
Nathan Kaplan, Claire Kramer Mills, and Asani Sarkar, “Did Changes to the Paycheck Protection Program Improve Access for Underserved Firms?,” Federal Reserve Bank of New York Liberty Street Economics, July 6, 2022, https://libertystreeteconomics.newyorkfed.org/2022/07/did-changes-to-the-paycheck-protection-program-improve-access-for-underserved-firms/
BibTeX: View |
Related reading:
Who Benefited from PPP Loans by Fintech Lenders? (May 27, 2021)
Who Received PPP Loans by Fintech Lenders? (May 27, 2021)
Small Business Credit Survey: 2021 Report on Employer Firms
Disclaimer
The views expressed in this post are those of the author(s) and do not necessarily reflect the position of the Federal Reserve Bank of New York or the Federal Reserve System. Any errors or omissions are the responsibility of the author(s).
 RSS Feed
 Follow Liberty Street Economics