


Today, the New York Fed introduces several new data series and interactive charts depicting findings from its Survey of Consumer Expectations (SCE). The SCE is a representative, internet-based monthly survey of a rotating panel of about 1,300 household heads in the United States. Since January 2014, we have been reporting findings from our monthly survey on U.S. households’ views on inflation, household income and spending growth, their expectations about the housing and labor market, and a range of other expectations about the economy and outcomes for their own household. In addition to publishing interactive charts showing national trends as well as trends by demographic groups (such as age, income, education, numeracy, and geography), we also post the underlying microdata online (with a nine-month lag) to make it available for research purposes. We are adding three new data series to our interactive charts today. The first two concern expectations about future inflation, and the third concerns expectations of future home price growth.
One of the original goals behind the creation of the SCE was the expansion and improvement of existing quantitative measures of consumer inflation expectations. We did so by collecting consumers’ inflation point and density forecasts at the short-term (one-year-ahead) and medium-term (three-year-ahead) horizons. The measure at the medium-term horizon (that is, over the twelve-month period starting in two years from today) has provided valuable perspective on the perceived persistence of expected changes in short-term inflation. Similarly, the elicitation of density forecasts, in which respondents assign probabilities to different future outcomes of inflation, has allowed us to capture uncertainty about future inflation, a measure of which is tracked in SCE survey results. Although the series for short- and medium-term inflation expectations have moved closely together since the start of the survey in June 2013, they have diverged notably since the onset of the pandemic. Median one-year-ahead expectations surged to a series high of 6.8 percent in June 2022 and have been trending downwards since, while median three-year-ahead inflation expectations increased at a slower rate during the pandemic, peaking at 4.2 percent in October 2021 before trending down to 2.9 percent in September 2022. This divergence between short- and medium-term inflation expectations has also sparked interest in the movements in longer-term expectations.
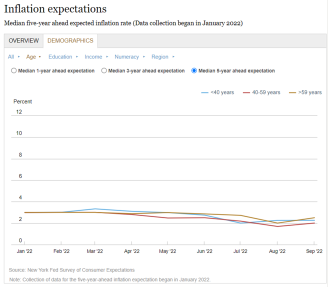
The first new interactive charts data we release today show median five-year-ahead inflation expectations and provide separate breakdowns by demographic groups. This measure, which we started collecting on an ad hoc basis since January of this year, captures expectations of inflation over the twelve-month period starting four years from today. Note that our measure, based on a question asking specifically about inflation rather than prices in general, is different from that collected in the Michigan Survey of Consumers which asks respondents “By about what percent per year do you expect prices to go (up/down) on the average, during the next 5 to 10 years?”. Today’s release shows that, in contrast to short- and medium-term inflation, median expectations of long-term inflation remained remarkably stable near 3.0 percent in early 2022, then started to decline in recent months to 2.2 percent in September. As shown in the chart below, this trend is similar across age groups, and we also see little differences across education and income groups.
Long-term Inflation Expectations Have Remained Low and Comparable across Age Groups
The second new interactive charts data we release today display the average reported probabilities across respondents associated with different inflation outcomes, where we distinguish between negative inflation (deflation), inflation between 0 and 2 percent, inflation between 2 and 4 percent, and inflation over 4 percent. These average monthly probabilities comprise the average or aggregate density forecast (also sometimes referred to as the “consensus forecast”). The charts below show the evolution of the average density forecast for one- and three-year-ahead inflation. At the one-year horizon, the left panel shows a sharp increase in the average probability assigned to high inflation (4 percent and higher) since the onset of the pandemic, and a sharp reduction in the average likelihood of inflation between 0 and 4 percent. The chart also reveals that the series crossed a turning point over the past few months, with the average probability of high inflation now declining, but the distribution remains wider and shifted rightward towards higher inflation compared to pre-Covid.
The Average Likelihood of High Inflation Increased Sharply following the Pandemic, but Is Now Declining
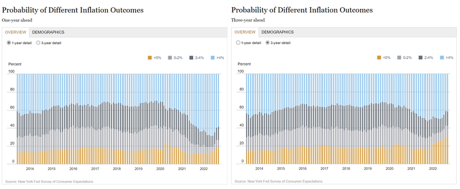
In contrast, the average density of three-year-ahead expectations, shown in the chart on the right, shows a similar widening of the distribution with a growing right tail at the beginning of the pandemic. However, since the fall of 2021, this distribution has shifted to the left with an increasing probability assigned to deflation three years from now. This pattern in the average density of medium-term inflation is similar across age, income, and education groups, although perhaps most notable for older (age over 59) respondents.
The third new data series released today reports expectations for three-year-ahead home price changes, measured as the expected change in the average home price nationwide over the twelve-month period starting two years from now. We show this overall and separately by respondent demographic characteristics including age, education, household income, numeracy skills, and Census region. When compared to the median one-year-ahead expected home price growth, median three-year-ahead expectations have been relatively stable during the pandemic, varying between a low of 3.4 percent in April 2020 and a high of 5.5 percent in May 2021. When differentiating respondents by residential location, we see a recent divergence in medium-term expectations, with residents of the South expecting relatively high and stable home price growth, and steep recent declines in the expected rate of growth for those living in the West, Midwest, and Northeast.
Except for Those from the South, Respondents Anticipate Smaller Increases in Home Price Growth

As the SCE continues to evolve, with occasional supplemental questions, we plan to provide further updates to our interactive charts and data releases. We believe that this new information will help inform both the public and policymakers on the changing perceptions and expectations of U.S. households.

Felix Aidala is a research analyst in the Federal Reserve Bank of New York’s Research and Statistics Group.

Olivier Armantier is the head of Consumer Behavior Studies in the Federal Reserve Bank of New York’s Research and Statistics Group.

Fatima-Ezzahra Boumahdi is a research analyst in the Federal Reserve Bank of New York’s Research and Statistics Group.

Gizem Kosar is a research economist in Consumer Behavior Studies in the Federal Reserve Bank of New York’s Research and Statistics Group.

Devon Lall is a research analyst in the Federal Reserve Bank of New York’s Research and Statistics Group.

Jason Somerville is a research economist in Consumer Behavior Studies in the Federal Reserve Bank of New York’s Research and Statistics Group.

Giorgio Topa is an economic research advisor in Labor and Product Market Studies in the Federal Reserve Bank of New York’s Research and Statistics Group.

Wilbert van der Klaauw is an economic research advisor on Household and Public Policy Research in the Federal Reserve Bank of New York’s Research and Statistics Group.
How to cite this post:
Felix Aidala, Olivier Armantier, Fatima-Ezzahra Boumahdi, Gizem Kosar, Devon Lall, Jason Somerville, Giorgio Topa, and Wilbert van der Klaauw, “New SCE Charts Include a Measure of Longer‑Term Inflation Expectations,” Federal Reserve Bank of New York Liberty Street Economics, October 11, 2022, https://libertystreeteconomics.newyorkfed.org/2022/10/new-sce-charts-include-a-measure-of-longer-term-inflation-expectations/
BibTeX: View |
Disclaimer
The views expressed in this post are those of the author(s) and do not necessarily reflect the position of the Federal Reserve Bank of New York or the Federal Reserve System. Any errors or omissions are the responsibility of the author(s).
 RSS Feed
 Follow Liberty Street Economics
Awesome charts!