


One of the current puzzles in economics is the recent worldwide slowdown in productivity, compared to the late 1990s and early 2000s. This productivity loss is economically large: if productivity growth had stayed at the same level as in 1995-2004, American GDP would have increased by trillions of dollars. In this post, I discuss a new paper that links this productivity slowdown to saturation in electronics adoption across most industries. I show that most of the productivity growth from electronic miniaturization is concentrated between 1985 and 2005.
Declining Productivity and Moore’s Law
In the U.S., average labor productivity growth in the 1995-2004 period was 2.85 percent per year. This productivity growth significantly declined in the following decade, to an average of 1.27 percent per year in the 2005-2015 period. This pattern is not unique to the United States. For a panel of OECD countries, Syverson (2017) shows that labor productivity growth fell from 2.3 percent in the 1995-2004 period, to 1.1 percent over the 2005-2015 period.
I propose that saturation of electronics in other industries may explain the dynamics of productivity growth. When computers first were introduced, they were very large and heavy, and were only used in very specialized applications. Due to constant improvements in semiconductor manufacturing technology, electronic transistors shrank by 50 percent every eighteen months, a trend known as Moore’s Law. As computers and electronics decreased in size and weight, they were adopted as inputs by more and more industries—including virtually all manufacturing and service industries—leading to increased productivity across the economy. In Azar (2022), I use a new data set of products’ weights to estimate the effect of Moore’s Law on productivity growth.
Electronic Miniaturization Leads to New Product Combinations
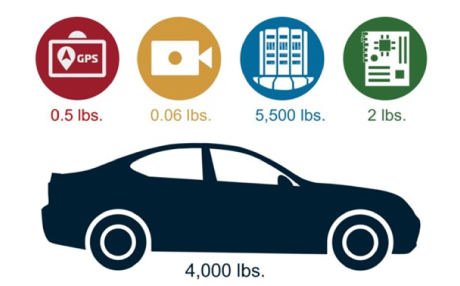
To estimate how electronic miniaturization affects productivity growth, I develop a new model where firms have different methods or “recipes’’ to make their products, and the productivity of each method depends on the combination of inputs used in production. For example, there are many different ways to produce a car, depending on which materials are used. A car from the 2020s with thousands of microchips and a carbon-fiber alloy frame will be much safer, comfortable, and efficient than a car from the 1950s that has no electronic components and has a steel frame.
In this model, there are physical limits on which inputs can be combined to make a product. The reason why cars or industrial machines from the 1950s did not rely on electronics isn’t because computers didn’t exist, but because they were too large and heavy to be practically used in production. This is illustrated below.
I use a new data set of products’ weights from IHS Markit to determine the median weight of each industry’s product. I combine this with supply chain tables from the Bureau of Economic Analysis (BEA) to determine how much each input’s weight contributes to the final product’s weight. With this combined data set, I can simulate what happens to the supply chain as the size of electronics and semiconductors decreases.
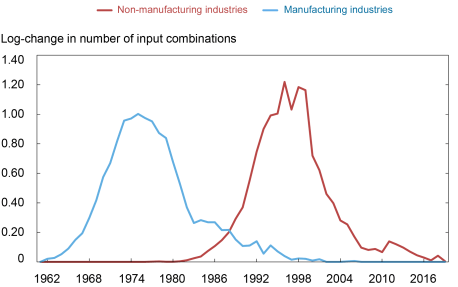
As electronics and computers decrease in size, the number of possible input combinations used by different manufacturing and service industries increases. The chart below shows the log-change in the number of possible input combinations for the average manufacturing and the average non-manufacturing industry. From the chart, we can see that the number of new possible combinations for manufacturing starts increasing in the 1960s, peaks in the 1970s, and drops off slowly starting the 1980s through the early 2000s. In contrast, the number of new possible combinations for non-manufacturing industries starts rising in the early 1980s, peaks in the late 1990s and early 2000s, and declines since then—with a small bump in the early 2010s.
Number of New Combinations
These patterns showing the adoption of new input combinations arising from electronic miniaturization match the historical adoption of computers and electronics in different industries. Manufacturing industries, such as airplane manufacturers or industrial machine producers, were early adopters of computers and electronic components. Even though computers of the time were large, the machines being produced at the time were large enough to fit them.
At the same time, computers were only widely adopted in non-manufacturing industries—such as finance, services and retail—after the introduction of the IBM and Apple personal computers (PCs) in the 1980s. PCs allowed a large number of desk workers to have access to their own device, instead of having to rely on a company-wide mainframe. The introduction of laptops, smartphones and tablets, allowed service providers on the field to carry a computing device on them at all times. Furthermore, the miniaturization of electronics led to formerly “dumb” devices such as cameras and medical equipment to have their own computational abilities.
New Product Combinations Lead to Increased Productivity
So far, we have seen that electronic miniaturization has led to an increase in the number of feasible combinations of inputs, both for manufacturing and non-manfacturing industries. But does this increase productivity? I show that this is indeed the case, by regressing industry-level productivity on the number of feasible input combinations made possible by electronic miniaturization. The regression results imply that a 1 percent increase in input combinations leads to a 0.004 percent increase in industry productivity.
I then use this estimated regression coefficient—together with the time series on the number of feasible combinations—to estimate the effect of Moore’s Law on each industry’s productivity. Finally, I aggregate the industry-specific estimates to obtain an estimate of how electronic miniaturization affected the entire U.S. economy over time. The results are shown in the next chart. The yellow line shows the realized productivity trend, while the blue line shows the productivity attributable to Moore’s Law. The red line shows another measure, which does not take into account productivity spillovers between different industries. In total, about 11.74 percent of all productivity gains between 1960 and 2020 can be attributed to electronic miniaturization.
Productivity Growth Attributable to Electronic Miniaturization
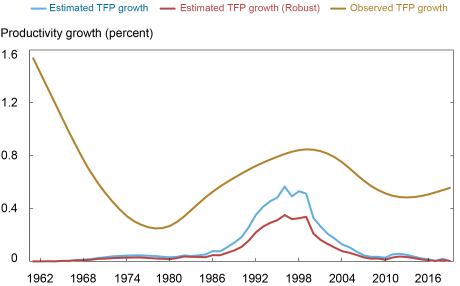
Most of these productivity gains are concentrated in the 1985-2005 period, when computers and electronics were incorporated into virtually every industry. During this period, Moore’s Law accounts for 14.22 percent of all productivity growth. An important observation from the chart is that, after the mid-2000s, productivity contributions from Moore’s Law become negligible and overall productivity declined. Before 1985, computers were still too large to make a significant contribution to the performance of most services and products. After 2005, computers had become so small that they had already become essential in almost every industry, and any subsequent adoption since then has only led to incremental improvements in productivity. This suggests that a large part of the post-2005 productivity slowdown can be explained by the saturation of electronics adoption. Once electronics were small enough to be used in almost all industries, their effect on productivity vanished.

Pablo Azar is a financial research economist in Money and Payments Studies in the Federal Reserve Bank of New York’s Research and Statistics Group.
How to cite this post:
Pablo Azar, “Computer Saturation and the Productivity Slowdown,” Federal Reserve Bank of New York Liberty Street Economics, October 6, 2022, https://libertystreeteconomics.newyorkfed.org/2022/10/computer-saturation-and-the-productivity-slowdown/
BibTeX: View |
Disclaimer
The views expressed in this post are those of the author(s) and do not necessarily reflect the position of the Federal Reserve Bank of New York or the Federal Reserve System. Any errors or omissions are the responsibility of the author(s).
 RSS Feed
 Follow Liberty Street Economics