


Over the past fifteen years, reserves in the banking system have grown from tens of billions of dollars to several trillion dollars. This extraordinary rise poses a natural question: Are the rates paid in the market for reserves still sensitive to changes in the quantity of reserves when aggregate reserve holdings are so large? In today’s post, we answer this question by estimating the slope of the reserve demand curve from 2010 to 2022, when reserves ranged from $1 trillion to $4 trillion.
What Are Reserves? And Why Do They Matter?
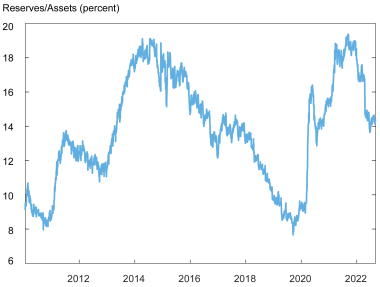
Banks hold accounts at the Federal Reserve where they keep cash balances called “reserves.” Reserves meet banks’ various needs, including making payments to other financial institutions and meeting regulatory requirements. Over the past fifteen years, reserves have grown enormously, from tens of billions of dollars in 2007 to $3 trillion today. The chart below shows the evolution of reserves in the U.S. banking system as a share of banks’ total assets from January 2010 through September 2022. The supply of reserves depends importantly on the actions of the Federal Reserve, which can increase or decrease the quantity of reserves by changing its securities holdings, as it did in response to the global financial crisis and the COVID-19 crisis.
Reserves Have Ranged from 8 to 19 Percent of Bank Assets from 2010 to 2022
Why does the quantity of reserves matter? Because the “price” at which banks trade their reserve balances, which in turn depends importantly on the total amount of reserves in the system, is the federal funds rate, which is the interest rate targeted by the Federal Open Market Committee (FOMC) in the implementation of monetary policy. In 2022, the FOMC stated that “over time, the Committee intends to maintain securities holdings in amounts needed to implement monetary policy efficiently and effectively in its ample reserves regime.” In this ample reserves regime, the Federal Reserve controls short-term interest rates mainly through the setting of administered rates, rather than by adjusting the supply of reserves each day as it did prior to 2008 (as discussed in this post). In today’s post, we describe a method to measure the sensitivity of interest rates to changes in the quantity of reserves that can serve as a useful indicator of whether the level of reserves is ample.
The Demand for Reserves Informs Us about Rate Sensitivity to Reserve Shocks
To assess whether the level of reserves is ample, one needs to first understand the demand for reserves. Banks borrow and lend in the market for reserves, typically overnight. The reserve demand curve describes the price at which these institutions are willing to trade their balances as a function of aggregate reserves. Its slope measures the price sensitivity to changes in the level of reserves. Importantly, banks earn interest on their reserve balances (IORB), set by the Federal Reserve. Because the IORB rate directly affects the willingness of banks to lend reserves, it is useful to describe the reserve demand curve in terms of the spread between the federal funds rate and the IORB rate. In addition, we control for the overall growth of the U.S. banking sector by specifying reserve demand in terms of the level of reserves relative to commercial banks’ assets.
There is a clear nonlinear downward-sloping relationship between prices and quantities of reserves, consistent with economic theory. The chart below plots the spread between the federal funds rate and the IORB against total reserves as a share of commercial banks’ total assets. When reserves are very low, the demand curve has a steep negative slope, reflecting the willingness of borrowers to pay high rates because reserves are scarce. At the other extreme, when reserves are very high, the curve becomes flat because banks are awash with reserves and the supply is abundant. Between these two regions, an intermediate regime–that we refer to as “ample”–emerges, where the demand curve exhibits a modest downward slope. The color coding of the chart reflects the shifts in the reserve demand curve over time. In particular, the curve appears to have moved to the right and upward around 2015 and then moved upward after March 2020, at the onset of the COVID pandemic.
Reserve Demand Has Shifted over Time

This chart highlights two of the main challenges in estimating the slope of the reserve demand curve. First, the curve is highly nonlinear, which means that a standard linear estimation approach is not appropriate. Second, various long-lasting changes in the regulation and supervision of banks, in their internal risk-management frameworks, and in the structure of the reserve market itself have resulted in shifts in the reserve demand curve. A third challenge is that the quantity of reserves may be endogenous to banks’ demand for them. Therefore, to properly measure the reserve demand curve, one must disentangle shocks to supply from those to demand. As we explain in detail in a recent paper, our estimation strategy addresses all three of these challenges.
Estimating the Slope of the Reserve Demand Curve
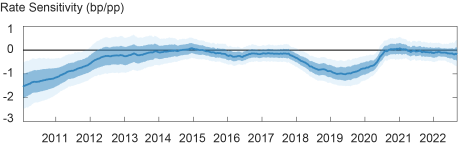
Our approach provides time-varying estimates of the price sensitivity of the demand for reserves that can be used to distinguish between periods in which reserves are relatively scarce, ample, or abundant. The chart below presents our daily estimates of the slope of the demand curve, as measured by the rate sensitivity to changes in reserves. Although we do not have a precise criterion for when reserves are scarce versus ample, during two episodes in our sample, the estimated rate sensitivity is well away from zero. The first episode occurs early in our sample, in 2010, and the second emerges almost ten years later, in mid-2019. In two other periods—during 2013-2017 and from mid-2020 through early September 2022—the estimated slope is very close to zero, indicating an abundance of reserves. The remaining periods are characterized by a modest negative slope of the reserve demand curve, consistent with ample (but short of abundant) reserves. The overall pattern of these estimates is robust to changes in the model specification, such as including spillovers from the repo and Treasury markets or measuring reserves as a share of gross domestic product or bank deposits (instead of as a share of banks’ assets).
Rate Sensitivity Changed over Time, Following the Path of Reserves
Interest Rate Spreads Alone Are Not Reliable Indicators of Reserve Scarcity
As we discuss in our paper, the time variation in the estimated price sensitivity in the demand for reserves is based on observations of small movements along the demand curve due to exogenous supply shocks. The location of the curve itself, however, also changes over time. That is, there is not a constant relationship between the level of reserves and the slope of the reserve demand curve.
In our paper, we find evidence of both horizontal and vertical shifts in the reserve demand curve, with vertical upward shifts being particularly important since 2015. This finding implies that the level of the federal funds-IORB spread may not be a reliable summary statistic for the sensitivity of interest rates to reserve shocks, and that estimates of the price sensitivity in the demand for reserves provide additional useful information.
In summary, we have developed a method to estimate the time-varying interest rate sensitivity of the demand for reserves that accounts for the nonlinear nature of reserve demand and allows for structural shifts over time. A key advantage of our methodology is that it provides a flexible and readily implementable approach that can be used to monitor the market for reserves in real time, allowing one to assess the “ampleness” of the reserve supply as market conditions evolve.

Gara Afonso is the head of Banking Studies in the Federal Reserve Bank of New York’s Research and Statistics Group.

Gabriele La Spada is a financial research economist in Money and Payments Studies in the Federal Reserve Bank of New York’s Research and Statistics Group.

John C. Williams is the president and chief executive officer of the Federal Reserve Bank of New York.
How to cite this post:
Gara Afonso, Gabriele La Spada, and John C. Williams, “Measuring the Ampleness of Reserves,” Federal Reserve Bank of New York Liberty Street Economics, October 5, 2022, https://libertystreeteconomics.newyorkfed.org/2022/10/measuring-the-ampleness-of-reserves/
BibTeX: View |
Disclaimer
The views expressed in this post are those of the author(s) and do not necessarily reflect the position of the Federal Reserve Bank of New York or the Federal Reserve System. Any errors or omissions are the responsibility of the author(s).
 RSS Feed
 Follow Liberty Street Economics