


Housing is the single largest element of the typical household’s budget, and data from the SCE Household Spending Survey show that this is especially true for renters. As the housing market heated up in the latter stages of the pandemic, home prices and rents both began to rise sharply. For renters, some protection from these increases was afforded by national, state, and in some cases local eviction moratoria, which greatly reduced the risk of households losing access to stable housing if they couldn’t afford their rent. Yet many of these protections have expired and additional supports will do so soon. In this post, we draw on data from our SCE Housing Survey to explore how renters perceive their housing risk and find that the answers depend to a large degree on their current and past experiences of the housing market.
COVID-Era Trends in Rental Housing
The pandemic period has been tumultuous for U.S. renters. The sharp recession that began as the pandemic took hold early in 2020 buffeted the labor incomes of renters, who are more likely to work in jobs that require close physical proximity and can’t shift to work-from-home. Federal support came in many forms, including enhanced unemployment compensation and stimulus checks that allowed renters to continue making their lease payments. At the same time, evictions were forestalled by a complex series of federal, state, and local interventions that kept the eviction rate at low levels. As these programs ended, federal rental assistance was put in place to avoid evictions. These latter programs were initially slow to disburse funds, although by now most of the programs have been implemented.
In the initial stages of the pandemic, rent increases slowed relative to their recent trends, but by mid-2021 an increase in the demand for space, a reduced average household size (including more renters seeking their own units), and supply chain pressures began to drive up the prices of all housing at historic rates. In August 2022, the CPI-U for rent of primary residences was nearly 7 percent above its August 2021 level and more than 10 percent above the pre-pandemic level.
The SCE Housing Survey
We examine renters’ outlook for the housing market using the SCE Housing Survey, an annual module of the New York Fed’s Survey of Consumer Expectations (SCE). The Housing Survey, which has been fielded every February since 2014, asks questions specific to respondents’ housing market expectations; responses to those questions can then be combined with the standard expectations questions asked in the monthly core SCE. The 2022 survey includes 1,242 respondents, about one-quarter of whom are current renters. In this post, we focus on renters’ expectations regarding price increases and risks of eviction; more detail on other housing survey results is available in an earlier LSE post, an interactive web feature, and a chart package.
In the 2022 survey, as in 2019 and 2020, we asked all households about their experiences with and knowledge of evictions. More specifically, we asked whether respondents know anyone who has been evicted from a property they were renting since 2006, as well as whether the respondents themselves have ever been evicted. (Given the limitations on evictions in place for 2021, we did not ask these questions last year.) In addition, given the changes in eviction policies taking place in 2022, we asked for the first time about current renters’ expectations about their future likelihood of eviction. We did this in a probabilistic way, asking “What is the chance that you will be evicted in the next twelve months?”
To our knowledge, questions about eviction expectations are rare, especially when asked of a representative sample as opposed to renters who are already showing signs of financial distress. (The Census Pulse Survey for June 29-July 11 reports that about a quarter of renters who are currently behind on their rent expect a zero chance of eviction over the next two months; this population is those behind on their rent, which likely pushes expected eviction rates up.)
Fortunately, a large majority of renters in our 2022 survey—69.8 percent—report a zero chance of being evicted by February 2023. About 20 percent of respondents report a chance of between 1 and 10 percent, and the remaining 10 percent report a chance of eviction of 10 percent or more. Since this is the first time we’ve asked these questions, we don’t have historical data for comparison, but we do have the respondents’ history of eviction experiences. Not surprisingly given the limitations on evictions that were in place during 2021, the shares of respondents who report having ever been evicted themselves or knowing someone who was evicted since 2006 remain very close to their 2019-20 levels, at about 4 percent and 24 percent, respectively. As in previous years, past experiences with eviction are considerably more common among lower-income renters (see the chart below), but they can be found in respondents of all tenure types and incomes. In the next section, we explore whether these experiences with evictions are related to individuals’ perceptions of their housing market risks.
Respondents Earning $30,000 or Less Have Much Greater Exposure to Eviction
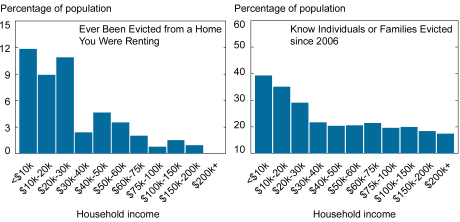
Notes: Chart pools the results of survey years 2019, 2020, and 2022. Percentages reflect nationally weighted estimates.
Correlates of Eviction Expectations
The survey reveals that both owners and renters expect rent increases in their own zip codes to accelerate over the next year. Renters expect apartment rents to rise by 15 percent. The largest increases in rents are expected by lower-income respondents and respondents in areas with lower housing costs, as shown in the next chart, which displays results for the last three surveys.
Rent Increases Are Expected to Be Highest in Lower-Cost Areas and for Lower-Income Respondents
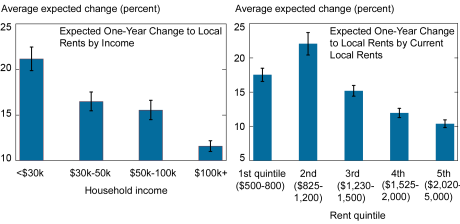
Notes: Chart pools the results of survey years 2019, 2020, and 2022. Percentages reflect nationally weighted estimates. Local rent is the typical rent in a respondent’s zip code.
Given the substantial increase in rent growth expectations we’ve seen over the past year, it is natural to anticipate that renters in markets with high expected rent increases would feel themselves most vulnerable to eviction over the next year. This might be especially true for respondents who expect their income to rise more slowly than rents; such a decline in expected housing affordability seems a plausible predictor of inability to pay rent and a consequent increase in eviction risk.
Expectations of increased housing cost do in fact turn out to be a statistically significant predictor of respondents’ perceptions of their eviction risk, but the relationship is small in magnitude. Other things equal, a respondent expecting a 20 percent rent increase in her zip code over the next year perceives only about a one percentage point higher risk of eviction compared to someone expecting no rent increase.
Interestingly, a more important driver of eviction expectations is previous experience with eviction. The chart below shows the effect of reporting a past eviction of oneself or an acquaintance on expectations of eviction over the next year. Those respondents who know someone who was evicted since 2006 perceive their own chance of eviction as being 2.5 percentage points higher than other respondents, holding other differences across respondents equal. Even more striking, those who have experienced an eviction themselves see their chance of eviction over the next year as 13 percentage points higher, again irrespective of how their housing affordability evolves. Inclusion of income and rent expectation controls do not have much effect on these estimates, and these controls themselves have little impact on eviction expectations. These results are consistent with previous research indicating that evictions frequently become a spiral for households, as well as the notion that previous experiences make eviction risk more salient for renters.
Eviction History Is a Powerful Predictor of Expectations of Eviction
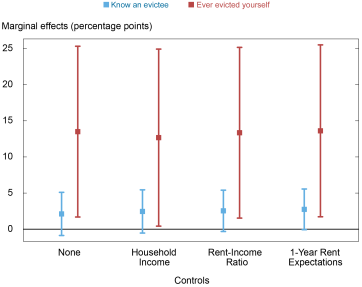
Notes: The y-axis displays the coefficients on eviction exposure or past eviction from regressions of eviction expectation on exposure and history, with the controls noted on the
x-axis. Markers indicate point estimates; lines display the 95 percent confidence intervals for the effects. Data come from the 2022 survey wave, as no prior waves considered eviction expectations.
Conclusion
Our 2022 SCE Housing Survey reveals that, like house price expectations, expectations for rent increases over the next year are well above historical norms. These expectations are highest in areas where rent is below the median, and among households with lower incomes. While a solid majority of respondents report no concerns about being evicted, about 30 percent see some chance of it. Previous personal experience with eviction is by far the largest predictor of this concern, suggesting that it may be present in a variety of economic environments. We’ll continue to monitor the experiences of renters in the economy as the housing market evolves in new directions in coming months.

Andrew F. Haughwout is director of Household and Public Policy Research in the Federal Reserve Bank of New York’s Research and Statistics Group.

Ben Hyman is a research economist in Urban and Regional Studies in the Federal Reserve Bank of New York’s Research and Statistics Group.

Benjamin Lahey is a research analyst in the Federal Reserve Bank of New York’s Research and Statistics Group.

Jason Somerville is a research economist in Consumer Behavior Studies in the Federal Reserve Bank of New York’s Research and Statistics Group.
How to cite this post:
Andrew Haughwout, Ben Hyman, Benjamin Lahey, and Jason Somerville, “Eviction Expectations in the Post‑Pandemic Housing Market,” Federal Reserve Bank of New York Liberty Street Economics, October 4, 2022, https://libertystreeteconomics.newyorkfed.org/2022/10/eviction-expectations-in-the-post-pandemic-housing-market/
BibTeX: View |
Disclaimer
The views expressed in this post are those of the author(s) and do not necessarily reflect the position of the Federal Reserve Bank of New York or the Federal Reserve System. Any errors or omissions are the responsibility of the author(s).
 RSS Feed
 Follow Liberty Street Economics