


Since the advent of derivatives trading on short-term interest rates in the 1980s, financial commentators have often interpreted market prices as directly reflecting the expected path of future interest rates. However, market prices generally embed risk premia (or “term premia” in reference to measures of risk premia over different horizons) reflecting the compensation required to bear the risk of the asset. When term premia are large in magnitude, derivatives prices may differ substantially from investor expectations of future rates. In this post, we assess whether term premia have increased with the recent rise in inflation, given the historically positive relationship between the two series, and what this means for the interpretation of derivatives prices.
Estimating Term Premia
A common way to measure term premia is to use a dynamic term-structure model (DTSM) that prices bonds and matches the time-series dynamics of yields. Using a term-structure model, the term premium may be estimated as the difference between the fitted yield of a zero-coupon bond and the model’s forecast for the average short-term risk-free rate over a horizon equal to the bond’s maturity. Defined in this way, the term premium has the interpretation of an expected return measure for an investor who purchases a longer-dated bond that is financed at the short-term risk-free rate.
The chart below plots the yield and term premium for a two-year zero-coupon bond in the Adrian-Crump-Moench (ACM) term-structure model from January 1962 to June 2022. The chart shows that the historical term premium estimates were at their peak during the high inflation period of the late 1970s and early 1980s; estimates of the term premium were as high as 1 to 2 percent at this time but have, in general, experienced a downward secular trend over the subsequent forty years.
Term Premiums Were High when Interest Rates and Inflation Were High
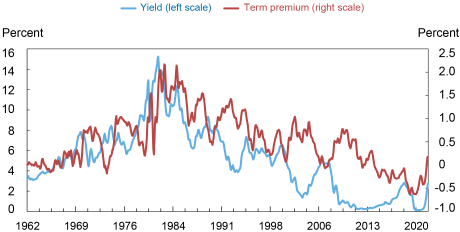
Note: This chart plots a three-month moving average of the two-year fitted yield against the two-year term premium from the Adrian-Crump-Moench (ACM) five-factor model using monthly data from January 1962 to June 2022.
The term premia estimates based on the ACM term-structure model have several attractive features including being available over a long sample period that dates to the 1960s. At the same time, term premia estimates from any DTSM are ultimately model specific. To complement the DTSM approach, we also estimate short-dated term premia using survey-based measures of expected interest rates and the market-implied path of short-term interest rates from derivatives. This approach does not rely on a specific forecasting model or bond pricing model. Instead, the term premia estimate is obtained as the market-implied path less the survey-expected path.
To illustrate how the survey-based estimates work, we consider an example from June 2022. The market-implied path of the federal (fed) funds rate is derived from fed funds futures contracts and overnight index swaps (OIS) on June 23, 2022. Survey expectations for the corresponding horizons are obtained from the Blue Chip Financial Forecasts (BCFF) survey at the end of June 2022 by computing the average forecast across participants over the forecast horizon. The market data are lagged by one week to approximate the information that forecasters may have had when submitting their forecasts prior to month-end. The survey-based term premia measure is the difference between the market-implied yield and the survey expectation.
As shown in the chart and table below, the survey expectations are above the market-implied yields on June 23, 2022, indicating that the survey-based term premia estimates are negative and equal to -17 basis points (bps) for a six-month horizon and -12 bps for a twelve-month horizon based on the OIS-implied rates. The term premia estimate using fed funds futures data over a six-month horizon is similarly negative at -14 bps.
Short-Dated, Survey-Based Term Premia in June 2022 Were Small
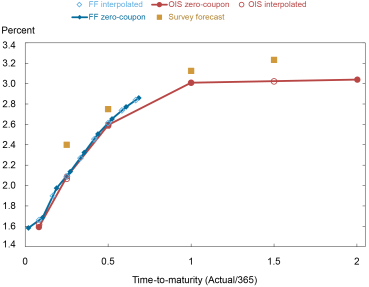
Notes: This chart plots the market-implied path of the fed funds rate from futures contracts (FF) and overnight index swaps (OIS) versus survey forecasts from the Blue Chip Financial Forecasts (BCFF) Survey. To derive the market-implied path, we bootstrap zero-coupon rates from raw OIS quotes and futures settlement prices from Bloomberg L.P. and then linearly interpolate to a fixed maturity grid. The chart reports the zero-coupon rates at the observed maturities and the interpolated rates which closely align. The survey forecast is the average forecast across participants which is then averaged across horizons to match the three-, six-, twelve-, and eighteen-month interpolated rates.
Survey-Based Term Premium Estimates for June 2022
| Horizon (months) | 3 | 6 | 12 | 18 |
|---|---|---|---|---|
| Implied rate from Overnight Index Swaps (OIS) | 2.07 | 2.58 | 3.01 | 3.02 |
| Implied rate from federal funds futures (FF) | 2.09 | 2.61 | ||
| Survey forecast average | 2.40 | 2.75 | 3.13 | 3.23 |
| OIS term premium | -0.33 | -0.17 | -0.12 | -0.21 |
| FF term premium | -0.31 | -0.14 |
Notes: The table reports implied rates and survey forecasts matching the chart above at the interpolated maturities. The implied zero-coupon rates are from June 23, 2022. The survey forecasts are from the June Blue Chip Financial Forecasts. The survey-based term premium is the difference between the implied rate and the survey forecast.
Short-Dated Term Premia Estimates and the Level of Inflation
We can apply the same approach as above to generate a long time series of survey-based term premia using the BCFF survey. The BCFF survey has forecasts available going back to 1982 for the fed funds rate and from 1987 to 2021 for the three-month Libor (London interbank offered rate). Combining these measures with the market-implied paths of interest rates for the three-month Libor from eurodollar futures and for the fed funds rate from fed funds futures and OIS, we expand on the ACM term-structure estimates to report survey-based term premia measures dating back to the 1980s.
The chart below illustrates the results. Each term premia measure is reported going as far back as possible subject to data availability. The eurodollar measure for the three-month Libor term premium stops in 2021 after which the BCFF switches to forecasting the secured overnight funding rate (SOFR) rather than Libor. Despite the differences in methodologies and data sources, the short-dated term premia measures follow a broad trend. During the 1980s and 1990s when inflation was generally higher, short-dated term premia were also higher. Since the early 2000s, the level of inflation and short-dated term premia have generally been low and relatively stable.
Term Premia Were Higher in the 1980s and Early 1990s
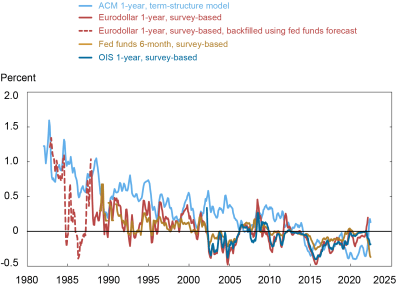
Notes: This chart reports the one-year term premium estimate from the Adrian-Crump-Moench (ACM) model alongside survey-based estimates using eurodollar futures, fed funds futures, and overnight index swaps (OIS). The ACM estimates are from the Federal Reserve Bank of New York. The survey-based estimates use market data that are lagged by one week to approximate the information that forecasters may have had when submitting their forecasts prior to month-end. The sample periods for the survey term premia measures are based on data availability. We use Blue Chip Financial Forecasts (BCFF) survey forecasts which are available from October 1982 for the fed funds rate and from December 1987 to December 2021 for the three-month Libor. Bloomberg L.P. data are employed for fed funds futures and OIS. For eurodollar futures, we use historical CME Group data from the start of the sample to March 2017 and then use Bloomberg data. When three-month Libor forecasts are unavailable in the early part of the sample, we backfill using the fed funds forecasts based on a projection that is estimated during the latter period when both series are available. The chart reports a three-month moving average of the monthly term premia estimates.
Zooming in on the more recent period, the chart below reports term premia estimates over different horizons using the ACM term-structure model and survey forecasts of fed funds futures and OIS data. The survey-based measures have remained close to zero since the onset of the Covid-19 crisis but have begun to decline in recent months, similar to the decrease going into the last rate hiking cycle that started at the end of 2015. Although the one-year and two-year ACM term premia have turned positive, they remain at low levels.
Various Measures of Short-Dated Term Premia Have Remained Low
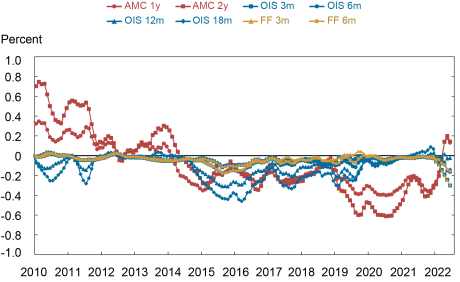
Notes: This chart reports a three-month moving average of the monthly term premia estimates since 2010 using the Adrian-Crump-Moench (ACM) term-structure model and using survey forecasts with fed funds futures (FF) and overnight index swaps (OIS) data over different horizons. The data are from the Federal Reserve Bank of New York, Bloomberg L.P., and the Blue Chip Financial Forecasts Survey.
To conclude, we have shown that historical estimates of term premia have tended to be high when inflation was also high. Given the recent rise in inflation, one might expect a commensurate rise in term premia. We find, however, that various measures of short-dated term premia have remained relatively small in magnitude, implying that current market prices do approximately reflect investors’ expectations for monetary policy over the near term.

Richard K. Crump is a financial research advisor in Macrofinance Studies in the Federal Reserve Bank of New York’s Research and Statistics Group.
Charles Smith is a former senior research analyst in the Federal Reserve Bank of New York’s Research and Statistics Group.

Peter Van Tassel is a financial research economist in Capital Markets Studies in the Federal Reserve Bank of New York’s Research and Statistics Group.
Disclaimer
The views expressed in this post are those of the author(s) and do not necessarily reflect the position of the Federal Reserve Bank of New York or the Federal Reserve System. Any errors or omissions are the responsibility of the author(s).
 RSS Feed
 Follow Liberty Street Economics