


The Federal Reserve Bank of New York’s November 2022 SCE Labor Market Survey shows a rise in the average reservation wage—the lowest wage respondents would be willing to accept for a new job—to $73,667, its highest level since the series began in 2014. Respondents’ satisfaction with wage compensation, non-wage benefits, and promotion opportunities at their current job all improved in November compared to July. Regarding expectations, the average expected wage offer (conditional on receiving one) also increased and reached a new high.
The SCE Labor Market Survey, which has been fielded every four months since March 2014 as part of the broader Survey of Consumer Expectations (SCE), provides information on consumers’ experiences and expectations regarding the labor market. The aggregated statistics, together with a companion set of interactive charts showing a subset of the data that we collect, are published every four months by the New York Fed’s Center for Microeconomic Data. As with other components of the SCE, we report statistics not only for the overall sample, but also by various demographic categories, namely age, gender, education, and household income. The underlying micro (individual-level) data for the full survey are made available with an eighteen-month lag.
The remainder of this post provides more details on the findings on reservation wages and focuses on the increase since the onset of the pandemic. We find that the predictors of higher-reservation wages have changed, with non-wage benefits playing a larger role than before the pandemic.
Reservation Wages
Our measure of reservation wage, or the lowest wage at which the respondent is willing to accept a new job, comes from the following question in the SCE Labor Market Survey:
Suppose someone offered you a job today in a line of work that you would consider. What is the lowest wage or salary you would accept (BEFORE taxes and other deductions) for this job?
This question is posed to all respondents (to those who are employed, unemployed, or out of the labor force) and it provides an important metric that summarizes current wage dynamics. For those who are out of work, this metric provides information on the trade-off between the transfers tied to being out of work in addition to benefits of leisure and expected salaries. For those who are currently employed, this metric gives information on the trade-off between workers’ current and expected salaries as well as between current and expected non-wage amenities.
When we look at the series for employed and non-employed (unemployed or out of the labor force) respondents separately, as in the chart below, we observe that the average reservation wage has been increasing for both groups since late 2017, but more so since the onset of the pandemic. In addition, the chart displays the increase since the onset of the pandemic (since March 2020) to be more pronounced for employed respondents. Specifically, while the average reservation wage increased by 19.4 percent between March 2020 and November 2022 for employed respondents, it increased by around 12 percent for non-employed respondents in the same time period. Among the employed respondents, we observe the highest rise in this time period for those without a college degree (a 27 percent increase).
The Upward Trend in Reservation Wages Is Primarily Driven by Employed Respondents
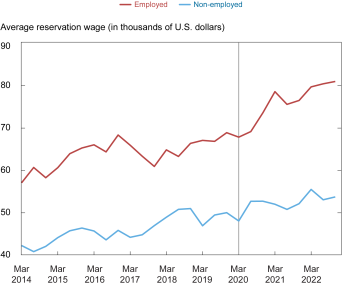
Note: The vertical line represents the start of the pandemic.
Revision in Reservation Wages
Now that we know how reservation wages evolved since the onset of the pandemic and that the increase is prominently driven by employed respondents, the next step is to explore the reasons why workers are revising up their reservation wages. To analyze this, we relate workers’ reservation wage adjustments to changes in their earnings growth expectations, inflation expectations, U.S. unemployment rate expectations, actual salaries, and satisfaction at their current jobs. We do this analysis separately for the pre-pandemic (between March 2014 and November 2019, the last data point in the SCE Labor Market module before the pandemic) and post-pandemic (between March 2020 and November 2022) periods. The table below presents the results from these regressions.
Determinants of Reservation Wages Have Changed for Employed Workers Since the Onset of the Pandemic
| Revision in | Pre-Pandemic | Post-Pandemic |
|---|---|---|
| Wage growth expectations | 0.17*** | -0.07 |
| (0.07) | (0.12) | |
| 1-year inflation expectations | 0.01 | -0.00 |
| (0.08) | (0.08) | |
| 3-year inflation expectations | 0.04 | 0.09 |
| (0.08) | (0.08) | |
| U.S. unemployment rate expectations | -0.01 | -0.03 |
| (0.01) | (0.02) | |
| Salary ($1,000s) | (0.41)*** | 0.32*** |
| (0.03) | (0.03) | |
| Satisfaction with compensation | 0.61* | 0.37 |
| (0.32) | (0.45) | |
| Satisfaction with non-wage benefits | 0.20 | 1.57*** |
| (0.31) | (0.48) | |
| Satisfaction with promotion opportunities | 0.09 | 0.26 |
| (0.18) | (0.30) | |
| Constant | -0.14 | -12.57 |
| (7.78) | (14.26) | |
| Observations | 3,200 | 1,596 |
| R-squared | 0.08 | 0.10 |
Before the pandemic, revisions in reservation wages were positively and significantly related to revisions in earnings growth expectations, revisions in actual salaries, and revisions in satisfaction with compensation at their existing jobs. For example, a 10-percentage point revision in earnings growth expectations was associated with a $1,700 revision in reservation wages for workers, while a unit increase in satisfaction with compensation (in a 5-unit scale) was associated with a $613 revision in reservation wages. Interestingly, revisions in their expectations about the aggregate economy in the form of inflation expectations or the probability with which they think the U.S. unemployment rate would be higher in a year were not influential in how workers adjust their reservation wage.
Since the onset of the pandemic, however, we observe a change in how workers revise their reservation wages. In this period, as shown in the last column of the table, revision in reservation wages is positively and statistically significantly related to only changes in the reported salaries and changes in satisfaction with non-wage benefits at existing jobs. A $1,000 increase in the reported salary of an average worker is associated with a $318 increase in her reservation wage, keeping everything else constant, while this pass-through was around $414 before the pandemic. More importantly though, one unit increase in a worker’s satisfaction with the non-wage amenities of her existing job is, on average, associated with a $1,566 upward revision of her reservation wage.
These results show the rising importance of non-wage benefits—such as health and dental insurance, flexible work arrangements, maternity and paternity leaves—in workers’ labor supply decisions in the post-pandemic era. We currently observe the effect of this shift in workers’ preferences in reservation wages. Since workers’ preferences also determine the jobs they ultimately select, we are likely to see the impact of this change in preferences in labor market dynamics such as the types of jobs they transition to in the near future.
Conclusion
The November 2022 SCE Labor Market Survey results show a rise in the average reservation wage to a series high. The survey results show that the continued upward trend in this series is primarily driven by employed respondents. The results also demonstrate that the increase in existing salaries, but more significantly the respondents’ increase in satisfaction with non-wage amenities in their current jobs are the main drivers of the rise in reservations wages since the onset of the pandemic, keeping everything else constant.

Felix Aidala is a research analyst in the Federal Reserve Bank of New York’s Research and Statistics Group.

Gizem Kosar is a research economist in Consumer Behavior Studies in the Federal Reserve Bank of New York’s Research and Statistics Group.
How to cite this post:
Felix Aidala and Gizem Kosar, “SCE Labor Market Survey Shows Average Reservation Wage Continues Upward Trend,” Federal Reserve Bank of New York Liberty Street Economics, December 19, 2022, https://libertystreeteconomics.newyorkfed.org/2022/12/sce-labor-market-survey-shows-average-reservation-wage-continues-upward-trend/
BibTeX: View |


Disclaimer
The views expressed in this post are those of the author(s) and do not necessarily reflect the position of the Federal Reserve Bank of New York or the Federal Reserve System. Any errors or omissions are the responsibility of the author(s).
 RSS Feed
 Follow Liberty Street Economics