


This post presents an updated estimate of inflation persistence, following the release of personal consumption expenditure (PCE) price data for December 2022. The estimates are obtained by the Multivariate Core Trend (MCT), a model we introduced on Liberty Street Economics last year and covered most recently in a January post. The MCT is a dynamic factor model estimated on monthly data for the seventeen major sectors of the PCE price index. It decomposes each sector’s inflation as the sum of a common trend, a sector-specific trend, a common transitory shock, and a sector-specific transitory shock. The trend in PCE inflation is constructed as the sum of the common and the sector-specific trends weighted by the expenditure shares.
Modest Rise in the MCT
The MCT ticked up modestly to 3.7 percent in December from 3.6 percent in November (the value for November being itself revised down from 3.7 percent). As many sectors continue to experience high price volatility, uncertainty is high resulting in a 68 percent probability band (shaded area) of (3.2, 4.2). However, as the first chart shows, the probability band remains below the standard twelve-month core PCE measure, which in December declined to 4.4 percent.
PCE and Multivariate Core Trend
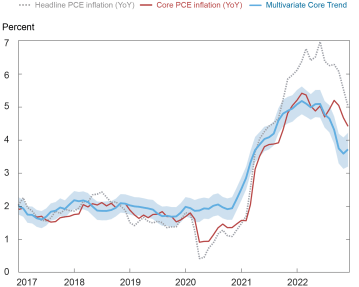
Notes: PCE is personal consumption expenditure. The shaded area is a 68 percent probability band.
Despite the apparent stability of the trend in the last two months, there were notable changes in its composition. The core goods trend subtracted 0.2 percentage points (ppts) from the MCT, while housing added 0.2 ppt. The core services ex-housing trend was essentially flat.
Considering this, the contribution of housing inflation to the increase in the persistent component of inflation from the onset of the pandemic, at about 1.1 ppts, is now more than twice as much as the cumulative contribution of goods and services ex-housing (0.4 ppt each), as shown in the following chart.
Inflation Trend Decomposition: Sector Aggregates
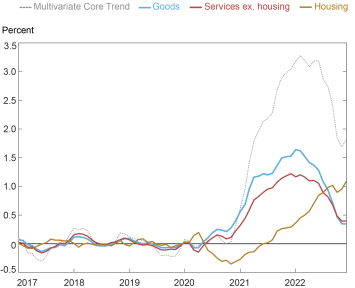
Note: The base for the calculations of the contributions to the change in the Multivariate Core Trend is the average over the period January 2017-December 2019.
A further element of contrast across sectors is the source of the persistence: in the housing sector, the persistence is all due to the sector-specific component of the trend, while core goods and services ex-housing are dominated by the common component, with their sector-specific components playing a small role (or even subtracting from the trend in the case of core goods), as illustrated in the chart below.
Finer Inflation Trend Decomposition
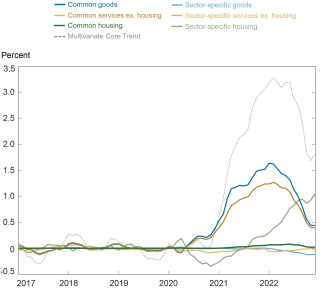
Note: The base for the calculations of the contributions to the change in the Multivariate Core Trend is the average over the period January 2017-December 2019.
We will provide a new update of the MCT and its sectoral insights after the release of January PCE data.

Martín Almuzara is a research economist in Macroeconomic and Monetary Studies in the Federal Reserve Bank of New York’s Research and Statistics Group.

Argia Sbordone is the head of Macroeconomic and Monetary Studies in the Federal Reserve Bank of New York’s Research and Statistics Group.
How to cite this post:
Martin Almuzara and Argia Sbordone, “Inflation Persistence—An Update with December Data,” Federal Reserve Bank of New York Liberty Street Economics, February 7, 2023, https://libertystreeteconomics.newyorkfed.org/2023/02/inflation-persistence-an-update-with-december-data/
BibTeX: View |


Disclaimer
The views expressed in this post are those of the author(s) and do not necessarily reflect the position of the Federal Reserve Bank of New York or the Federal Reserve System. Any errors or omissions are the responsibility of the author(s).
 RSS Feed
 Follow Liberty Street Economics
Thank you for this work, it is very helpful to see the deeper detail that contributes to the headline figures.
Are you able to elucidate the sector specific housing component at all? A straight interpretation of the trend there suggests it is contributing significantly to the overall inflation issue, but I am having trouble capturing what it means in real terms?