


Editor’s note: Since this post was first published, the y-axis label in the last chart has been corrected. February 15, 9:30 a.m.

The Federal Open Market Committee (FOMC) has increased the target range for the federal funds rate by 4.50 percentage points since March 16, 2022. In tightening the stance of monetary policy, the FOMC balances the risk of inflation remaining persistently high if the economy continues to run “hot” against the risk of unemployment rising as the economy cools. In this post, we review a quantitative approach to measuring the evolution of risks to real GDP growth, the unemployment rate, and inflation that is inspired by our previous work on “Vulnerable Growth.” We find that, in February, downside risks to real GDP growth and upside risks to unemployment moderated slightly, and upside risks to inflation continued to decline.
How Do We Measure Risks to Economic Activity?
Chair Greenspan began his speech at the 2003 Jackson Hole symposium by noting that “[u]ncertainty is not just an important feature of the monetary policy landscape; it is the defining characteristic of that landscape. . . . [T]he conduct of monetary policy in the United States at its core involves crucial elements of risk management, a process that requires an understanding of the many sources of risk and uncertainty that policymakers face and the quantifying of those risks when possible.” Similarly, in 2017, Chair Yellen said “. . . [T]he outlook is subject to considerable uncertainty from multiple sources, and dealing with these uncertainties is an important feature of policymaking.”
So how can we measure and quantify risks to the economic outlook? In “Vulnerable Growth,” we argue that risks to real activity evolve as economy-wide financial conditions change, with the probability of a decline in real activity rising as financial conditions tighten. This negative relationship between real activity and financial conditions is most apparent when the chances of a pronounced decline in real activity are relatively high—in other words, when the economy is “at risk.” The chart below shows the estimated distribution of average real GDP growth over the next four quarters as of November 2008, right before the Federal Reserve first undertook large-scale asset purchases, conditional on the information available at the time. The shaded area represents the probability that average real GDP growth over the next four quarters is below -9.9 percent, which, in November 2008, was assessed to be 10 percent. Thus, -9.9 percent is the 10th percent quantile (or percentile) of the conditional distribution of average real GDP growth over the following four quarters. A more negative (lower) estimate of the 10th percent quantile indicates greater downside risks to real GDP growth.
Large Downside Risks to Future Real GDP Growth When Financial Conditions Are Tight
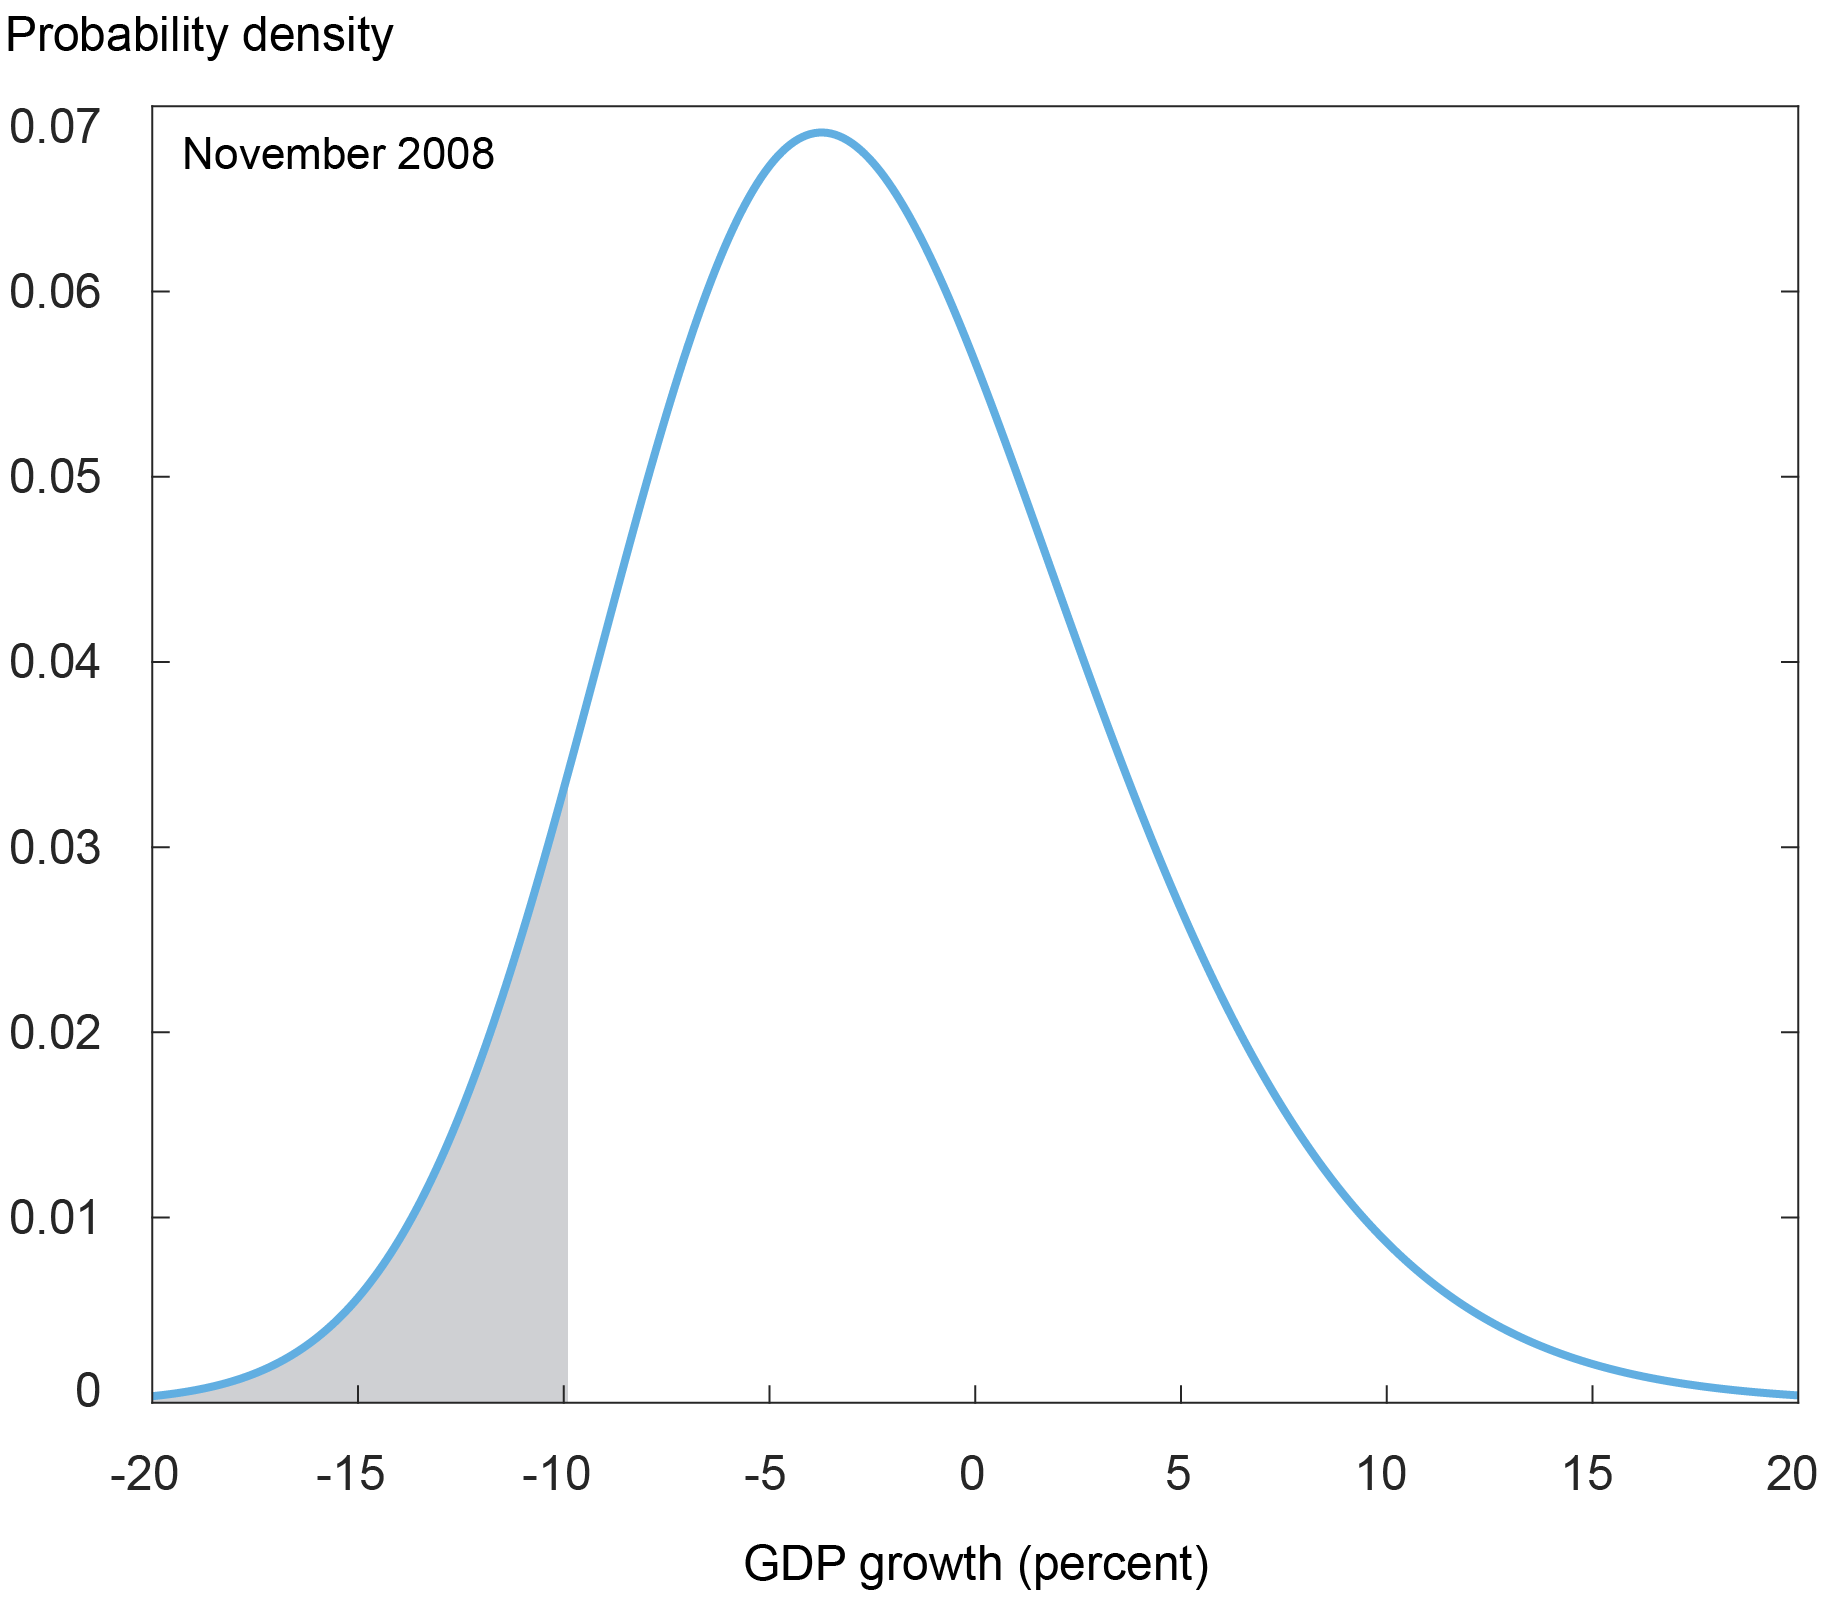
Notes: The chart shows the distribution of average real GDP growth over the next four quarters, conditional on financial conditions as of the end of October 2008 and the November 2008 Blue Chip Economic Indicators Survey. The gray shaded area indicates the part of the distribution below the 10th percent quantile.
In contrast, the next chart shows the estimated distribution as of November 2019, when financial conditions were relatively benign. The shaded region shows that the 10th percent quantile of the conditional distribution in November 2019 was only -0.1 percent. Moreover, we see that an average decline in real GDP growth over the next four quarters of more than 10 percent was assigned only a tiny probability at the time, as compared to November 2008. Note that the extremes of the distribution that correspond to small areas under the curve are often referred to informally as the “tails” of the distribution. In November 2019, a fall in real GDP growth of more than 10 percent was far in the “left tail” of the distribution.
Small Downside Risks to Future Real GDP Growth When Financial Conditions Are Benign
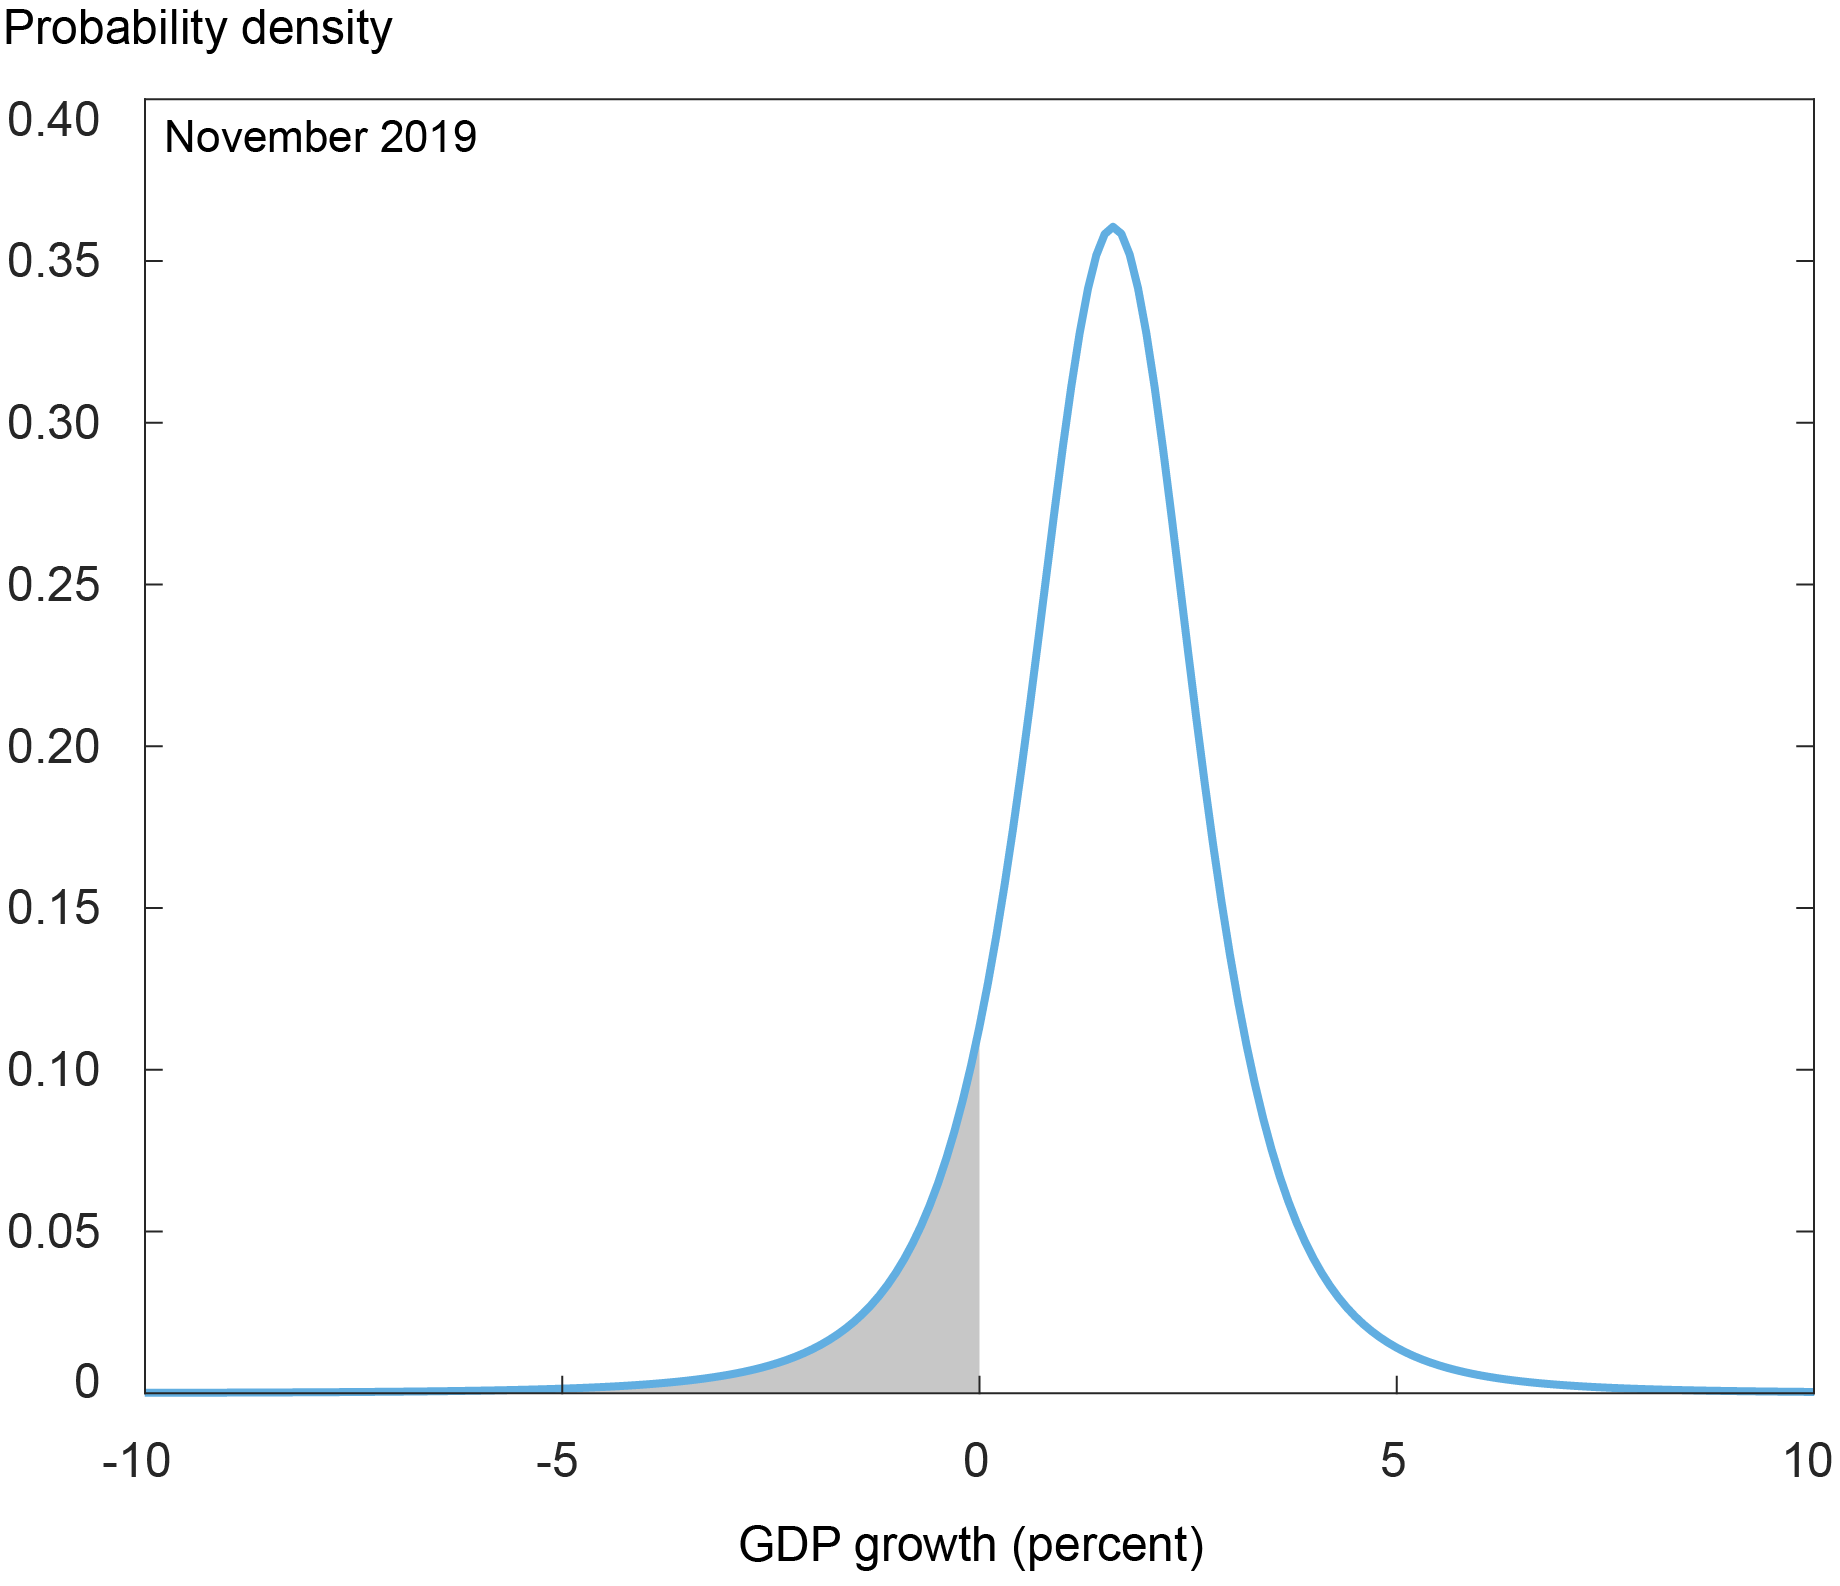
Notes: The chart shows the distribution of average real GDP growth over the next four quarters, conditional on financial conditions as of the end of October 2019 and the November 2019 Blue Chip Economic Indicators Survey. Gray shaded area indicates the part of the distribution below the 10th percent quantile.
How can we arrive at estimated distributions like those in the previous two charts? We rely on so-called quantile regressions, which allow us to assess how certain features of the distribution (in this case, particular quantiles) relate to the level of financial conditions. Suppose we are interested in the 25th percent quantile of real GDP growth. Quantile regressions allow us to estimate how the 25th percent quantile of our desired distribution co-moves with financial conditions. In a standard regression, the relationship is chosen to minimize the squared errors between future real GDP growth and current financial conditions. In quantile regressions, the relationship is instead chosen to minimize the absolute errors between future real GDP growth and current financial conditions. To do so, the quantile regression assigns different weights to observations above or below the predicted quantile. The next chart illustrates this weighting scheme using a 25th percent quantile regression. Observations that are above the predicted 25th percent quantile, which receive a lower weight, are shown in red. Observations that are below the predicted 25th percent quantile, which receive a higher weight, are in blue.
Negative Relationship between Financial Conditions and Downside Risks to Future Real GDP Growth
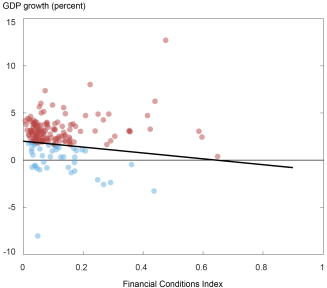
Notes: The chart shows average real GDP growth over the next four quarters versus financial conditions as measured by the ECB’s Composite Indicator of Systemic Stress (CISS). The line denotes the slope of the 25th percent quantile regression. Observations in red fall above the 25th percent quantile regression line; observations in blue fall below the 25th percent quantile regression line.
Repeating this exercise for different quantile choices begins to inform us on the overall shape of the conditional distribution of real GDP growth. To estimate the full distribution, we then choose the best fit from a large family of candidate distributions to the predicted 10th, 25th, 75th, and 90th percent quantiles. The fitted conditional distributions for two specific months (November 2008 and November 2019) are shown in the first two charts above.
How Have Risks to Economic Activity Changed Recently?
The next chart shows the historical time series of the estimated conditional quantiles of average real GDP growth over the following four quarters. We see that, over the course of 2022, the distribution widened considerably relative to the pre-pandemic, post-global financial crisis (post-GFC) baseline. The moderate easing of financial conditions since the beginning of October 2022 has led to a slight decline in downside risks to growth. That is, the 10th percent quantile of the conditional distribution of real GDP growth has modestly increased over the last few months. However, as of February 2023, there was still a 22 percent probability of average real GDP growth below -1 percent over the next four quarters.
Downside Risks to Growth Have Moderated Recently but Remain High by Historical Standards
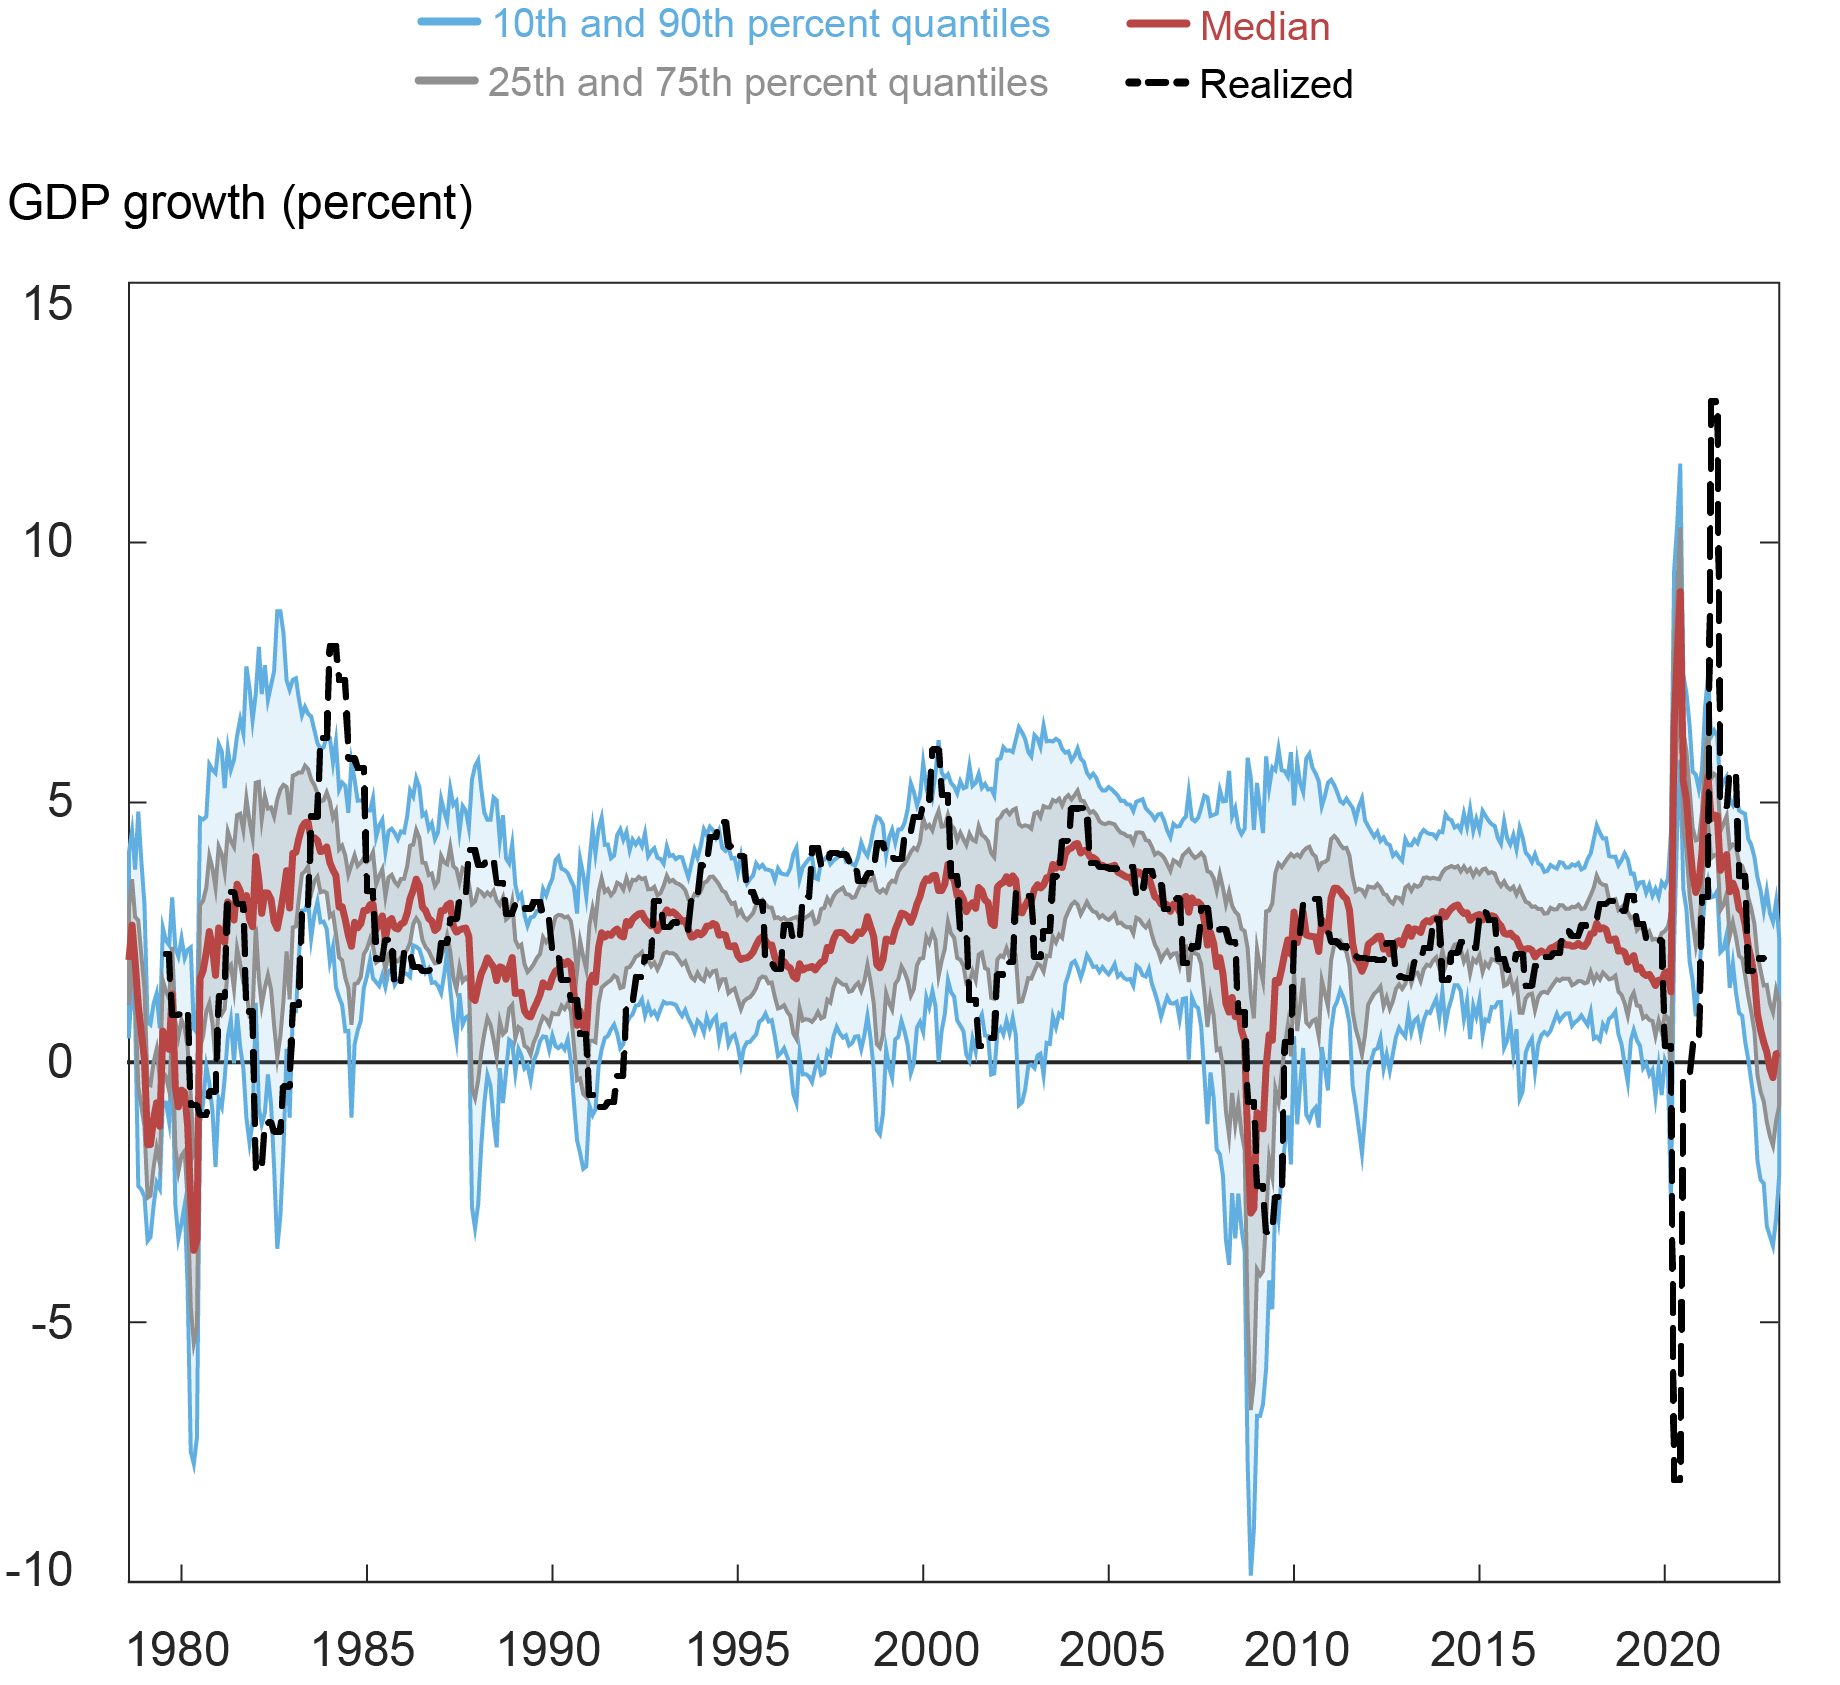
Notes: The chart shows selected quantiles of the predicted distribution of average real GDP growth over the next four quarters (10th and 90th in blue, 25th and 75th in gray) at each forecast date, together with the median forecast (red) and, when available, the realized four-quarter-average real GDP growth (black).
Turning next to the conditional distribution of the unemployment rate in four quarters’ time, we see in the chart below a substantial widening in the distribution relative to the pre-pandemic, post-GFC baseline. Moreover, for the first time since the Great Recession, the skewness of the distribution has increased, indicating a substantial probability of a rise in the unemployment rate. In contrast, a “normal” move in the conditional distribution of the unemployment rate during the pre-pandemic, post-GFC baseline has been either a decline in the right tail or a parallel shift of the overall distribution to the left (lower center of the distribution without a change in the shape). The predicted conditional distribution as of February 2023 indicates a 36 percent probability of the unemployment rate going above 5 percent in four quarters’ time, representing an elevated level of upside risk to the unemployment rate.
Upside Risks to Unemployment Remain High by Historical Standards
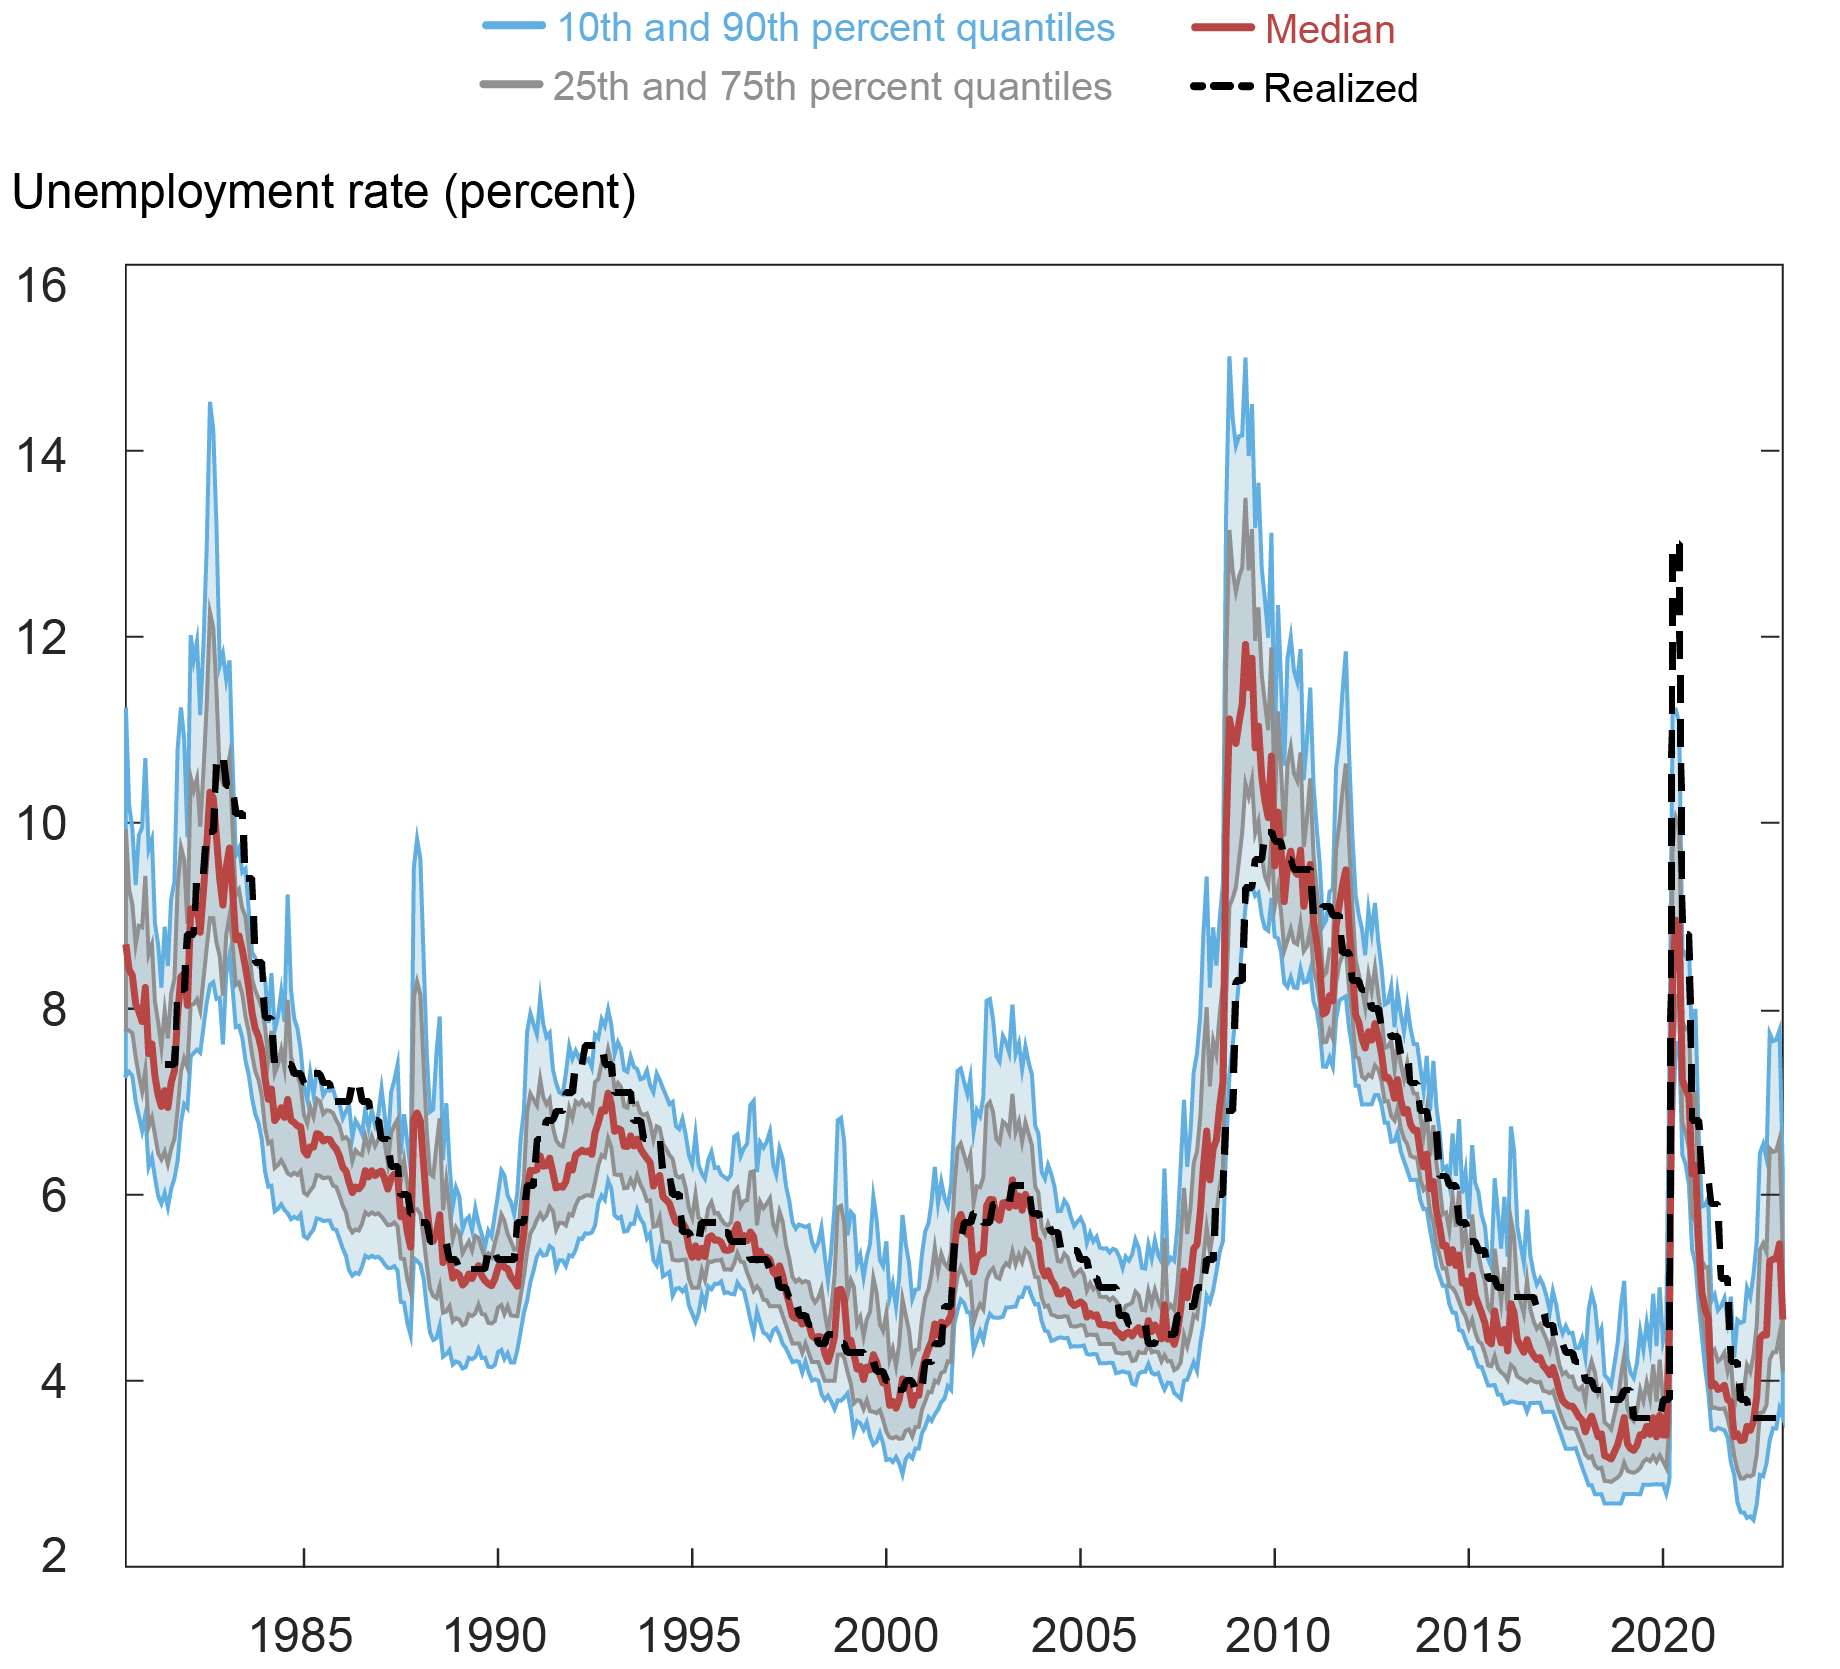
Notes: The chart shows selected quantiles of the predicted distribution of the average unemployment rate in four quarters’ time (10th and 90th in blue, 25th and 75th in gray) at each forecast date, together with the median forecast (red) and, when available, the realized four-quarter-ahead unemployment rate (black).
Finally, in the chart below, we see that the interquartile range (75th percent quantile less the 25th percent quantile) of the conditional distribution of CPI inflation increased historically quickly as financial conditions tightened in 2022, with both the left and right tails of the conditional distribution widening out. Moreover, the share of the interquartile range in the Q90-Q10 interquantile range (90th percent quantile less the 10th percent quantile) increased, indicating greater uncertainty around the median path of CPI inflation. More recently, upside risks to inflation have continued to decline, with the probability as of February 2023 of four-quarter-average CPI inflation remaining above 2.5 percent at 37 percent and the probability of four-quarter-average CPI inflation dropping below 1.5 percent at 32 percent.
Upside Risks to Inflation Have Started to Abate but Uncertainty Remains High
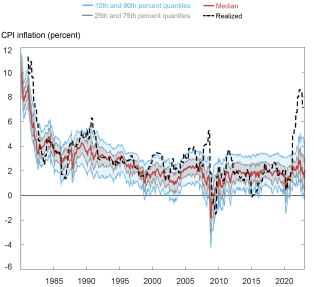
Notes: The chart shows selected quantiles of the predicted distribution of average CPI inflation over the next four quarters (10th and 90th in blue, 25th and 75th in gray) at each forecast date, together with the median forecast (red) and, when available, the realized four-quarter-average CPI inflation (black).
Why Do We Need a Quantitative Approach to Measuring Risks to the Forecast?
Chair Bernanke said in 2007 that “[u]ncertainty about the current state of the economy is a chronic problem for policymakers.” Indeed, since November 2011, the Summary of Economic Projections (SEP) of FOMC participants includes the distribution of participants’ assessments of the balance of risks around their projections and of the level of uncertainty relative to the past twenty years. “Outlook-at-risk” provides an objective way of quantifying the balance of risks around macroeconomic forecasts, capturing how such risks evolve as financial conditions tighten. So how do the quantiles-based distributions compare to the SEP submissions by FOMC participants?
Greater Uncertainty in Conditional Distribution of Unemployment Than Disagreement in SEP Forecasts
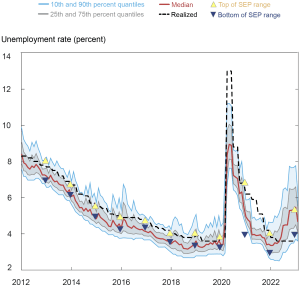
Notes: The chart shows selected quantiles of the predicted distribution of average unemployment rate in four quarters’ time (10th and 90th in blue, 25th and 75th in gray) at each forecast date, together with the median forecast (red) and, when available, the realized average unemployment rate in four quarters’ time (black). Yellow and blue triangles indicate the top and bottom (respectively) of the range of the Survey of Economic Projections as of each year’s December FOMC meeting.
The chart above compares the top and bottom of the range of the SEP as of each year’s December FOMC meeting to the estimated conditional quantiles of the four-quarter-ahead unemployment rate distribution. The range of SEP forecasts is almost always within the Q25-Q75 interquartile range of the corresponding distribution, with December 2012 and December 2020 the only exceptions. That is, the disagreement between FOMC participants about future economic outcomes tends to be smaller than the uncertainty implied by the conditional distributions. Quantitative approaches to measuring uncertainty around the modal forecast are thus a valuable tool for assessing the evolution of risks to the economic outlook in that they provide different information about these risks than a collection of modal forecasts from different forecasters.

Nina Boyarchenko is the head of Macrofinance Studies in the Federal Reserve Bank of New York’s Research and Statistics Group.

Richard K. Crump is a financial research advisor in Macrofinance Studies in the Federal Reserve Bank of New York’s Research and Statistics Group.

Leonardo Elias is a financial research economist in Macrofinance Studies in the Federal Reserve Bank of New York’s Research and Statistics Group.

Ignacio Lopez Gaffney is a research analyst in the Federal Reserve Bank of New York’s Research and Statistics Group.
How to cite this post:
Nina Boyarchenko, Richard Crump, Leonardo Elias, and Ignacio Lopez Gaffney, “What Is “Outlook‑at‑Risk?”,” Federal Reserve Bank of New York Liberty Street Economics, February 15, 2023, https://libertystreeteconomics.newyorkfed.org/2023/02/what-is-outlook-at-risk/
BibTeX: View |

Disclaimer
The views expressed in this post are those of the author(s) and do not necessarily reflect the position of the Federal Reserve Bank of New York or the Federal Reserve System. Any errors or omissions are the responsibility of the author(s).
 RSS Feed
 Follow Liberty Street Economics