


Since the late 1990s, the U.S. Treasury has issued debt in two main forms: nominal bonds, which provide fixed-cash scheduled payments, and Treasury Inflation Protected Securities—or TIPS—which provide the holder with inflation-protected payments that rise with U.S. inflation. At the heart of their relative valuation lie market participants’ expectations of future inflation, an object of interest for academics, policymakers, and investors alike. After briefly reviewing the theoretical and empirical links between TIPS and Treasury yields, this post, based on a recent research paper, explores whether market perceptions of U.S. sovereign credit risk can help explain the relative valuation of these financial instruments.
An Apparent Arbitrage on the Treasury Market
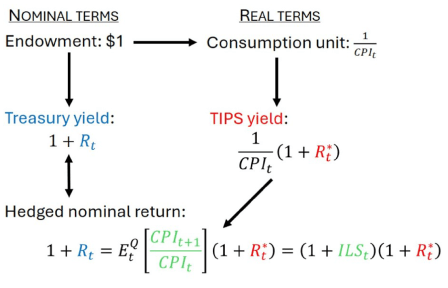
Financial intermediaries enter long and short positions on both nominal and inflation-protected Treasuries, which they typically hedge with inflation-linked swaps (ILS). No-arbitrage theory implies that it should be equivalent to buy a TIPS or to construct a synthetic position by buying a nominal Treasury bill and an inflation swap, such that the fixed cashflow is replaced by an inflation-adjusted one. Therefore, in principle, the ILS rate should be exactly equal to the so-called breakeven inflation rate (BEI)—the spread between the yield of a nominal Treasury and that of a TIPS of identical maturity (see the example described in the figure below).
The Inflation-Linked Swap Rate Is Linked to the Nominal and TIPS Rate by No-Arbitrage
In practice, the ILS has almost always been higher than the BEI, as shown in the chart below. The resulting inflation basis has averaged approximately 30 basis points since 2004, an anomaly that has been called the TIPS-Treasury bond valuation puzzle.
Five-Year Inflation Swap Rate Consistently Exceeds Five-Year Breakeven Inflation Rate
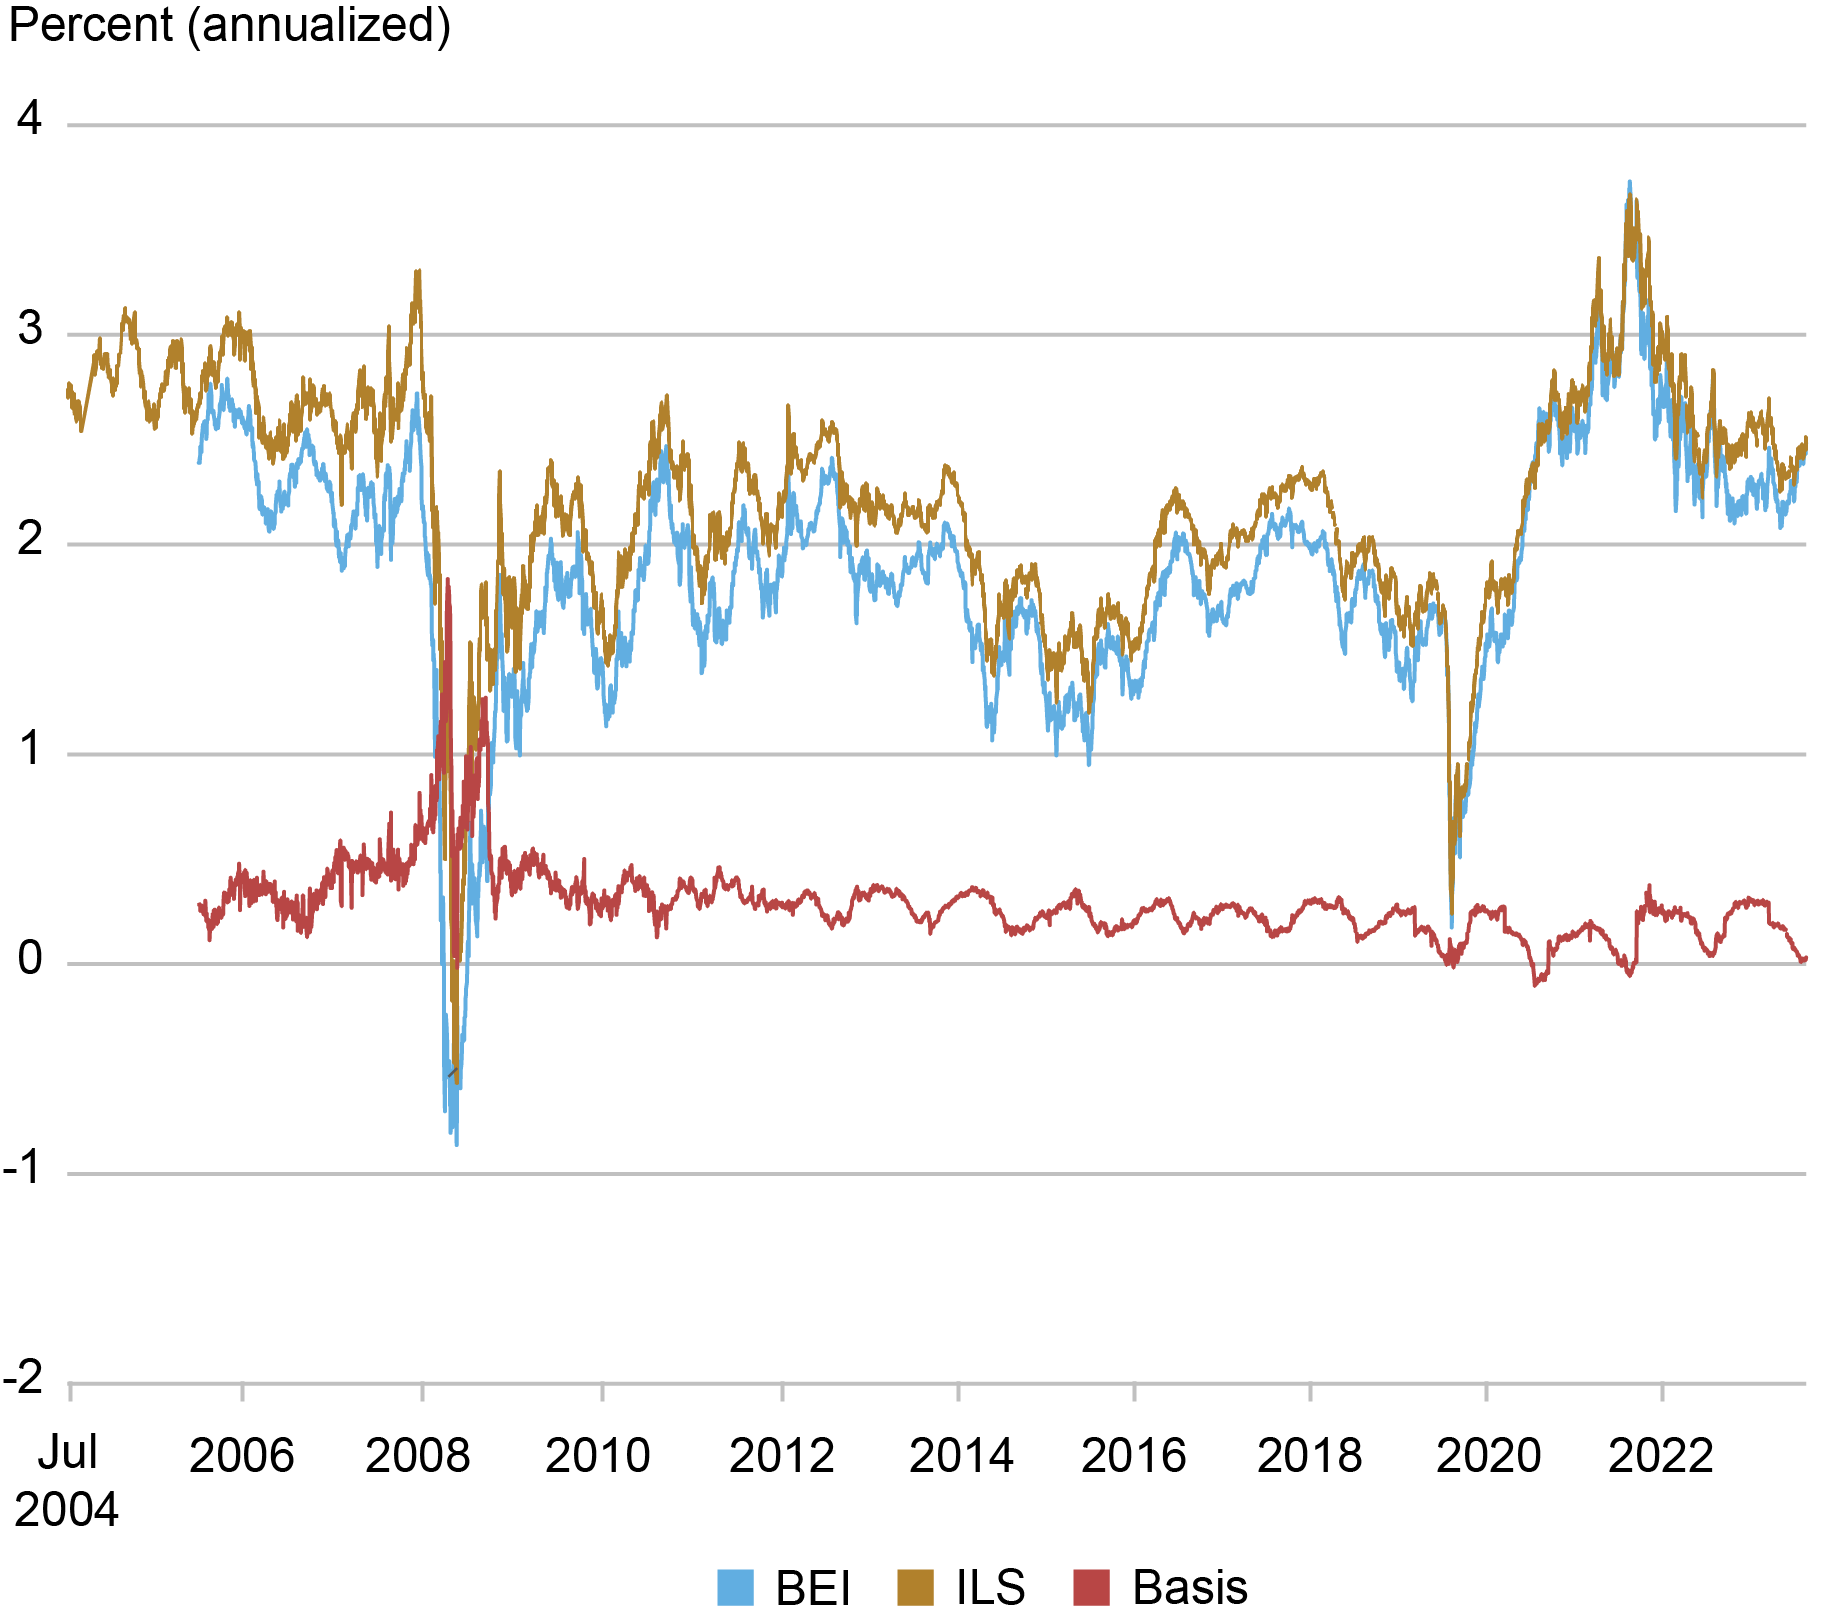
Source: Bloomberg L.P.
Notes: The blue line shows the five-year maturity breakeven inflation rate (BEI), defined as the spread between a five-year nominal Treasury yield and a five-year TIPS yield. The gold line is the rate of a five-year zero-coupon inflation-linked swap (ILS). The red line is the basis, i.e., the spread between the ILS and the BEI.
Existing explanations of the inflation basis have focused on limits to arbitrage, and on features and frictions of the TIPS market, whereby the TIPS’ relative cheapness is explained by its poorer liquidity. Instead, we focus below on the potential of sovereign credit risk to differentially affect Treasury yields and ILS- and TIPS-based inflation compensation.
There Are No Perfect Measures of Sovereign Credit Risk
Sovereign credit risk can be broadly defined as the probability of observing a credit event, which, according to the International Swaps and Derivatives Association, is whenever a government either (1) fails to repay, (2) repudiates or imposes a moratorium, or (3) restructures any of its borrowed money of any amount.
To assess the exposure of nominal Treasuries, TIPS, and ILS to sovereign credit risk, we need to find an indicator of the latter that moves sufficiently over time, thereby excluding credit ratings, which change infrequently. Since our estimates rely on linear regressions, it is sufficient that the indicator correlates with sovereign credit risk, but it does not need to be perfect.
Our research relies on two proxies that have been used extensively in the academic literature. First, Reinhart and Rogoff (2010) suggest that the ratio of a country’s outstanding debt to GDP is a non-market measure of its fiscal health. Second, researchers have used the premium paid on U.S. sovereign credit default swaps (CDS). These are insurance products that give purchasers compensation for bond losses that occur due to a U.S. credit event in exchange for a fixed premium paid every quarter. Recently, however, the reliability of CDS premia as a sovereign credit risk indicator has been questioned: The quantity of outstanding contracts has decreased sharply over the last decade—as demonstrated by Boyarchenko and Shachar (2020)—and the available data reflects quoted CDS spreads rather than actual traded spreads.
We find that both proxies are significantly and positively correlated with the inflation basis, above and beyond the part of the spread that is explained by TIPS liquidity and limits to arbitrage. To better understand why the spread is widening, we perform regressions on the individual components of the spread—i.e., the ILS, the nominal Treasury yield, and the TIPS yield—separately. Surprisingly, both the ILS and the nominal Treasury yield correlate negatively with the credit risk proxies, while the TIPS correlates positively, if anything.
Our empirical estimates are hard to reconcile with economic intuition. The nominal Treasury yield would be expected to have a positive correlation with sovereign credit risk since a U.S. credit event would likely lead to a loss for bondholders. In the same vein, since ILS are collateralized, we would expect their exposure to credit risk to be minimal rather than negative.
A Theory of Differential Exposure through Inflation Dynamics
What forces might explain our results? We first rule out the possibility that the market believes in a selective repayment of nominal Treasuries versus TIPS, where the latter would suffer more through, for example, the cancellation of inflation indexation. Intuitively, such a channel cannot rationalize the negative apparent exposure of nominal Treasuries and ILS to credit events.
Alternatively, the existence of an interconnection between inflation and the perceived likelihood of sovereign credit events can explain our empirical patterns. We identify two important relationships. First, the ILS negative correlation with sovereign credit risk can be rationalized if expected inflation decreases when market views of sovereign creditworthiness deteriorate. This was notably the case following the 2008 financial crisis in the U.S., when a drop in realized inflation and inflation expectations coincided with a higher sovereign credit risk. This channel impacts both the ILS and the nominal Treasury in the same way since they both require a compensation for inflation.
Second, the larger negative exposure of the nominal Treasury yield becomes plausible if we assume that realized inflation would jump upon the trigger of a credit event. While hyperinflation in the wake of a default is not uncommon in emerging countries, this assumption is highly speculative in the case of the U.S. since no such episode has arisen in the U.S. in almost 100 years.
This second channel adds an additional negative exposure to the nominal credit spread. To understand, imagine that a country’s price index jumps after a credit event has been observed. The real value of all nominal securities outstanding, irrespective of their defaultable nature, declines significantly. In other words, any promised cash payment buys less of a consumption basket. As a result, the nominal credit spread decreases as the likelihood of a sovereign credit event increases.
In contrast, TIPS are virtually unaffected by inflation dynamics given that their cash flows are in real terms. However, a credit event could lead to investor losses, as with nominal Treasuries, because of potential failure by the government to repay entirely its promised liabilities. TIPS exposure to credit risk is thus, if anything, positive.
Intricate Joint Dynamics of Inflation and Sovereign Credit Risk Are Supported Empirically
We assess the empirical plausibility of our theoretical channels by estimating an asset pricing model aimed at jointly fitting the term structure of ILS rates, nominal Treasury and TIPS yields, and CDS spreads. Our framework encompasses the possibility of sovereign credit events triggering CDS payments, as well as free correlations between expected inflation and sovereign credit risk and between realized inflation and credit events. We also embed liquidity drivers of TIPS and CDS to capture alternative possible explanations of the inflation basis.
Our estimates provide support for both interactions between inflation and credit event dynamics. We find that, on average, the inflation reaction to a credit event would be the largest driver of the inflation basis. Our framework also allows for a time series decomposition of the importance of sovereign credit risk in explaining the inflation basis. We show that credit risk concerns grow with a lag after 2008, such that the spike observed in the chart above is mostly due to poor TIPS liquidity, in line with previous findings. Post-2009 dynamics are, however, dominated by sovereign credit risk concerns, in line with our theory.

Guillaume Roussellet is a research economist in Macrofinance Studies in the Federal Reserve Bank of New York’s Research and Statistics Group.
How to cite this post:
Guillaume Roussellet, “Exploring the TIPS‑Treasury Valuation Puzzle,” Federal Reserve Bank of New York Liberty Street Economics, July 1, 2024, https://libertystreeteconomics.newyorkfed.org/2024/07/exploring-the-tips-treasury-valuation-puzzle/
BibTeX: View |


Disclaimer
The views expressed in this post are those of the author(s) and do not necessarily reflect the position of the Federal Reserve Bank of New York or the Federal Reserve System. Any errors or omissions are the responsibility of the author(s).
 RSS Feed
 Follow Liberty Street Economics