During 2018-19, the U.S. levied import tariffs of 10 to 50 percent on more than $300 billion of imports from China, and in response China retaliated with high tariffs of its own on U.S. exports. Estimating the aggregate impact of the trade war on the U.S. economy is challenging because tariffs can affect the economy through many different channels. In addition to changing relative prices, tariffs can impact productivity and economic uncertainty. Moreover, these effects can take years to become apparent in the data, and it is difficult to know what the future implications of a tariff are likely to be. In a recent paper, we argue that financial market data can be very useful in this context because market participants have strong incentives to carefully analyze the implications of a tariff announcement on firm profitability through various channels. We show that researchers can use movements in asset prices on days in which tariffs are announced to obtain estimates of market expectations of the present discounted value of firm cash flows, which then can be used to assess the welfare impact of tariffs. These estimates suggest that the trade war between the U.S. and China between 2018 and 2019 had a negative effect on the U.S. economy that is substantially larger than past estimates.
Tariff Announcements Caused Large Declines in U.S. Stock Returns
Our research shows that the tariff announcements greatly impacted firm stock-market valuations. We document this effect by examining the market movement on the earliest announcement dates in the media of each round of tariffs implemented by the U.S. and China.
The table below presents the list of announcement dates, a description of the announcements, and the corresponding (value-weighted) U.S. stock-market return on the trading day following the announcement. We find that stock-market returns are consistently big and negative, with particularly large drops following the March 2018 and May 2019 tariff announcements. The last line of the table shows the cumulative effect of these announcements across all event dates. Overall, the U.S. stock market fell 11.5 percent on days when tariffs were announced, which amounts to a $4.1 trillion loss in firm equity value.
Stock Market Returns on Days with Tariff Announcements
| Event Date | ln RM,t (x100) | Country | Description |
|---|---|---|---|
| 23 Jan 2018 | 0.3 | U.S. | U.S. imposes tariffs on solar panels and washing machines |
| 01 Mar 2018 | -1.1 | U.S. | U.S. imposes steel and aluminum tariffs |
| 22 Mar 2018 | -2.4 | U.S. | U.S. imposes $60 billion in annual tariffs on China |
| 23 Mar 2018 | -1.9 | China | China retaliates and announces tariffs on 128 U.S. exports |
| 15 Jun 2018 | -0.2 | China | China announces retaliation against U.S. tariffs on $50 billion of imports |
| 19 Jun 2018 | -0.4 | U.S. | U.S. announces imposition of tariffs on $200 billion of Chinese goods |
| 02 Aug 2018 | 0.5 | China | China unveils retaliatory tariffs on $60 billion of U.S. goods |
| 06 May 2019 | -0.4 | U.S. | U.S. to raise tariffs on $200 billion of Chinese goods up to 25 percent |
| 13 May 2019 | -2.5 | China | China to raise tariffs on $60 billion of U.S. goods starting June 1 |
| 01 Aug 2019 | -0.9 | U.S. | U.S. imposes a 10 percent tariff on another $300 billion of Chinese goods |
| 23 Aug 2019 | -2.5 | China | China retaliates with higher tariffs on soy and autos |
| Cumulative | -11.5 |
Notes: The first and last columns report the date and description of each event day. The second column reports the log stock-market return on each announcement day. ln RM,t is the log of one plus the proportional change of the stock-market return, defined as the value-weighted market portfolio return from CRSP.
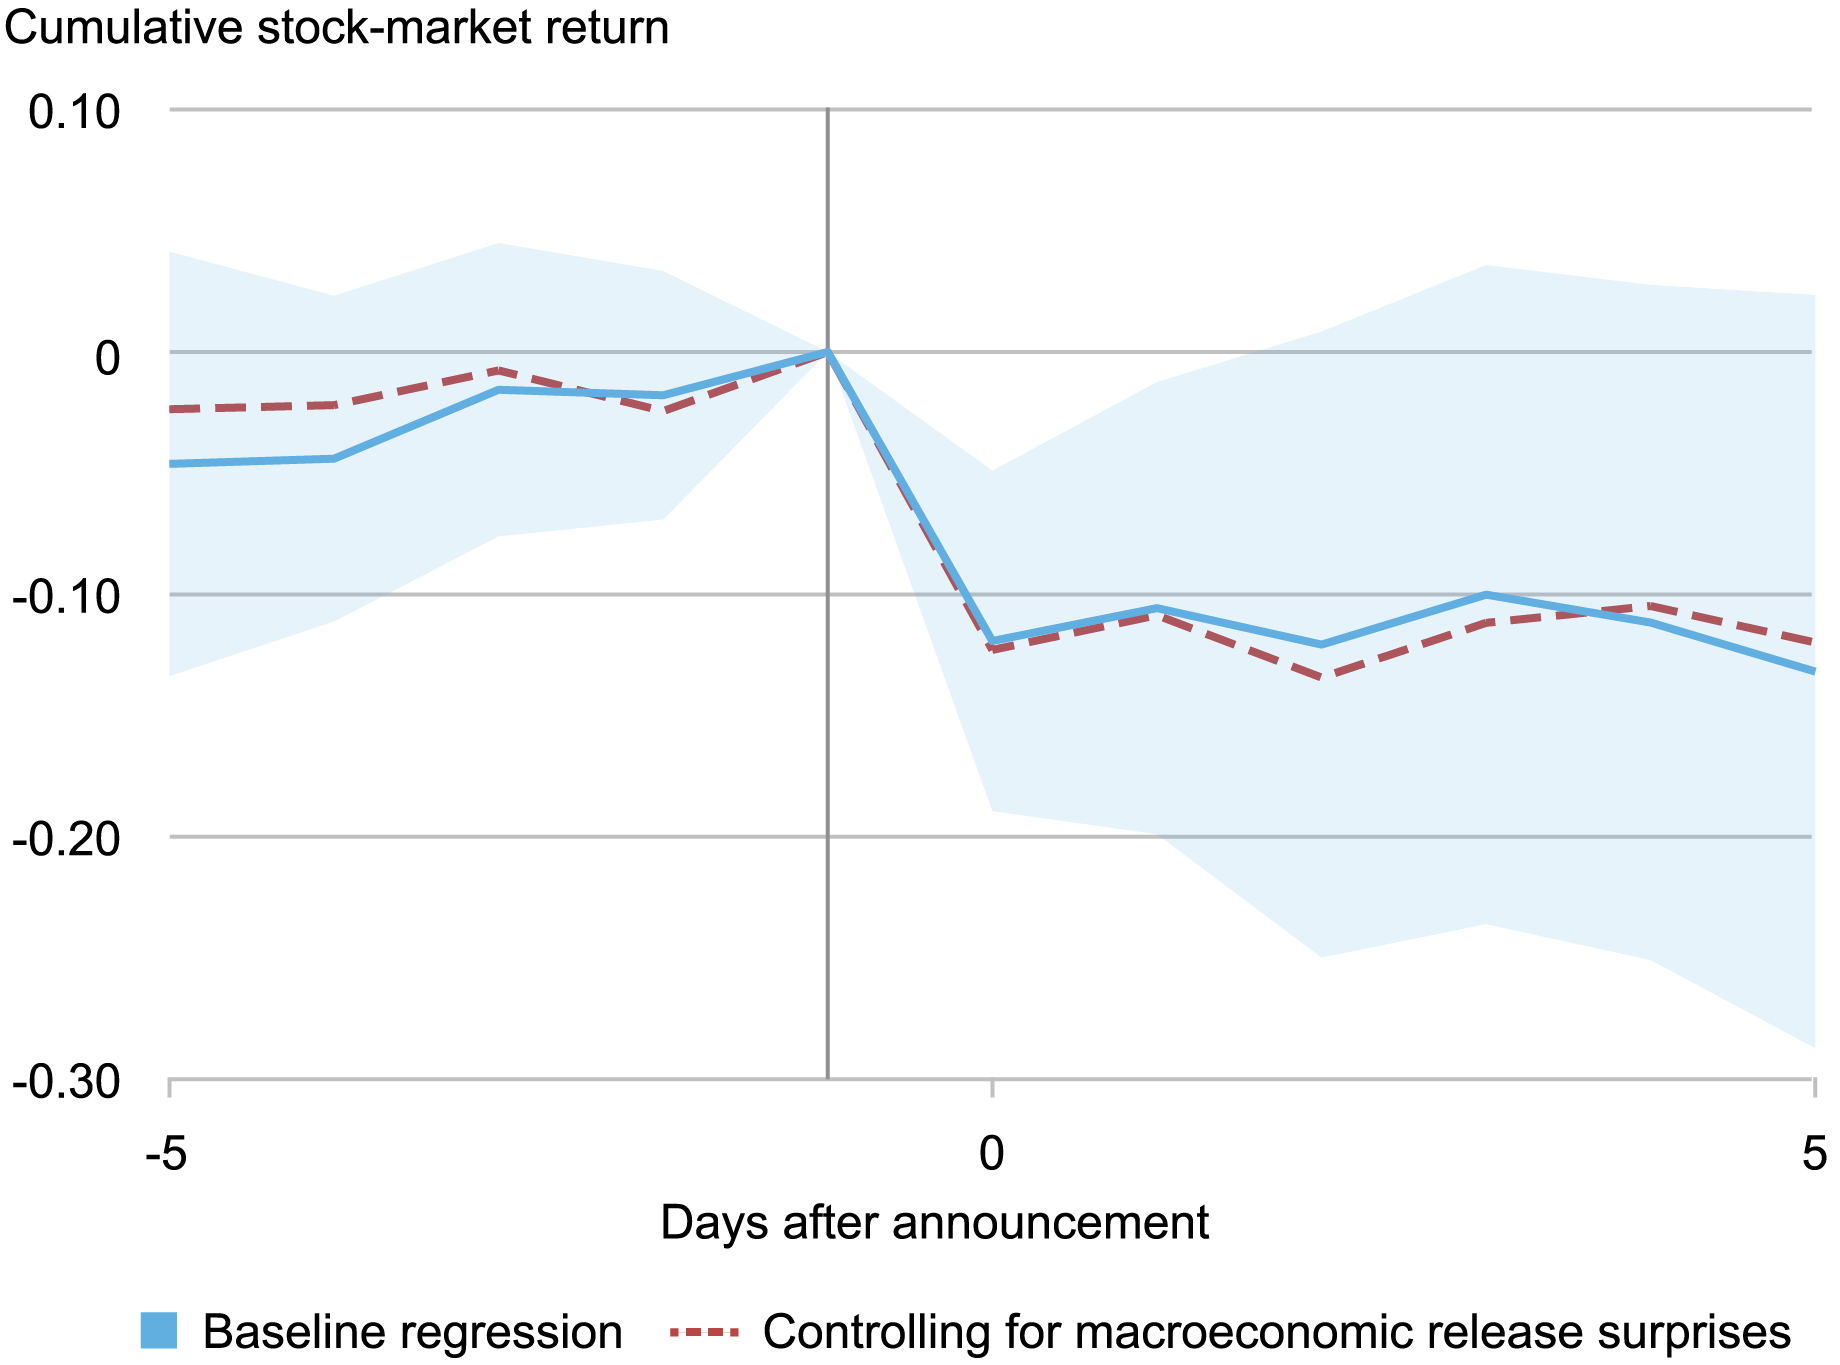
While one might be tempted to dismiss these declines as market overreactions, the data militates against this interpretation because the declines were persistent. The chart below shows the cumulative stock-market return over a ten-day window around the tariff announcements. We find that the effect entirely occurs on the trading days corresponding to the announcements, indicating that the market did not anticipate these announcements and did not bounce back in the week following the announcements. We also check that our findings cannot be explained by simultaneous announcements of other economic data (for example, announcements on employment) by controlling for the impact of these other announcements in the dashed line.
The Dynamics of Stock Market Returns Around Tariff Announcements

Tariff Announcements Led to Increased Uncertainty in the U.S. Economy
These stock-market price declines are likely to reflect two forces. First, markets may have become more pessimistic about future firm profits, and second, market participants may have become less willing to hold risky assets even if the expected path of future profits remained unchanged. To distinguish between these two forces, we analyze the effect of tariff announcements on market-based discount rate measures, which capture investors’ willingness to hold risky assets.
We begin by examining the cumulative response of Treasury yields, which are viewed as risk-free assets, on tariff announcement days. As shown in the chart below, tariff announcements lead to a sharp drop in nominal Treasury yields by 50 basis points across all maturities, with the largest effect observed at a five-year horizon. The chart also reports the response of real Treasury yields, which drop by 40 basis points. The drop in Treasury yields likely reflects market participants’ increased desire to hold safe assets.
Next, we examine the effect of tariff announcements on the equity premium, defined as the expected rate of return on equity relative to risk-free assets. While the equity premium is not directly observable, we focus on a lower bound constructed from the price of S&P 500 options (SVIX). As shown in the chart below, we estimate that the implied annualized equity premium increases by several percentage points (cumulatively) on announcement days.
To summarize, our evidence indicates that tariff announcements decreased real yields and increased equity premia, which is suggestive of a “flight to safety” among investors. After adjusting the decline in equity prices for these changes in discount rates, we estimate that approximately 40 percent (4.7 percentage points) of the decline in equity prices on tariff-announcement days can be attributed to changes in expected firm dividends (as opposed to changes in equity premia). Note that this estimate is silent on the timing of these dividend declines, which is consistent with the fact that no decline was observed immediately after the tariffs were announced.
Cumulative Effect of Tariff Announcements on Discount Rates

Note: The units on the vertical axes are the decimal representation of percentage changes, so 0.01 corresponds to a 1 percentage point change.
Reassessing the Aggregate Impact on the U.S. Economy
We use these results to estimate the overall welfare effect of tariffs. Conceptually, the welfare effect of tariffs is a weighted average of their effects on dividend income, interest income, labor income, and tax revenues. Combining the negative effects on firms and workers in the U.S. with increased government revenue from the tariffs, we estimate that the overall impact of tariff announcements on expected welfare is -3 percent. Although this welfare effect is considerably smaller than the -11.5 percent drop in stock-market valuations, it is significantly larger than the welfare predictions from standard trade models. This finding suggests that these models may overlook important channels by which tariffs could affect the economy, such as the dampening effect of tariffs on innovation, the negative consequences of increased trade uncertainty on investment, or the destabilizing impact of tariff announcements on global trade policies.

Mary Amiti is the head of Labor and Product Market Studies in the Federal Reserve Bank of New York’s Research and Statistics Group.
Matthieu Gomez is an associate professor of economics at Columbia University.
Sang Hoon Kong is an economics PhD student at Columbia University.
David E. Weinstein is the Carl S. Shoup Professor of the Japanese Economy at Columbia University.
How to cite this post:
Mary Amiti, Matthieu Gomez, Sang Hoon Kong, and David E. Weinstein, “Using Stock Returns to Assess the Aggregate Effect of the U.S.‑China Trade War,” Federal Reserve Bank of New York Liberty Street Economics, December 4, 2024, https://libertystreeteconomics.newyorkfed.org/2024/12/using-stock-returns-to-assess-the-aggregate-effect-of-the-u-s-china-trade-war/
BibTeX: View |
Disclaimer
The views expressed in this post are those of the author(s) and do not necessarily reflect the position of the Federal Reserve Bank of New York or the Federal Reserve System. Any errors or omissions are the responsibility of the author(s).


 RSS Feed
 Follow Liberty Street Economics