


This month marks five years since the start of the COVID-19 pandemic, after which subsequent policy responses upended most trends underlying student loans in the U.S. Beginning in March 2020, executive and legislative actions suspended student loan payments and the accumulation of interest for loans owned by the federal government. In addition, federal actions marked all past due and defaulted federal student loans as current, driving the delinquency rate on student loans below 1 percent by November 2022. Payments on federal student loans resumed in October 2023 after forty-three months of suspension. This post is the first of two highlighting trends in balances, repayment, and delinquency for student loans since the beginning of the COVID-19 pandemic and how trends may shift without pandemic supports.
Both posts highlight findings from the 2025 Student Loan Update, released today by the New York Fed’s Center for Microeconomic Data. In this post, we discuss how the policy responses due to the pandemic disrupted long-term trends in the growth of balances, the pace of repayment, and flow into delinquency. In the second post, we discuss how the resumption of payments and the return of negative credit reporting will adversely affect the credit standing of millions of student loan borrowers.
The Evolution of Student Loan Balances During the Pandemic
We begin by discussing trends in student loan balances since 2020 compared to the decade prior to the pandemic. The chart below comes from the Student Loan Update, which is computed using the New York Fed Consumer Credit Panel, a nationally representative sample of credit reports from Equifax. The chart shows total student loan balances in the last quarter of each year since 2004. After decades of strong growth in balances, the average annual growth rate for student loans stalled to 1.4 percent between 2020 and 2024 during the administrative forbearance period. The stall in the growth of balances was driven by several factors. The interest waiver dampened the growth in balances by removing the accumulation of interest for existing loans. Expanded and existing forgiveness programs erased nearly $190 billion in balances for more than 5 million borrowers since 2021. And reduced enrollment moderated the origination of student loans for new students. These factors combined to flatten the growth in aggregate balances even as the payment suspension put upward pressure on the growth in balances.
Growth in Outstanding Student Loans Slowed Considerably After 2020
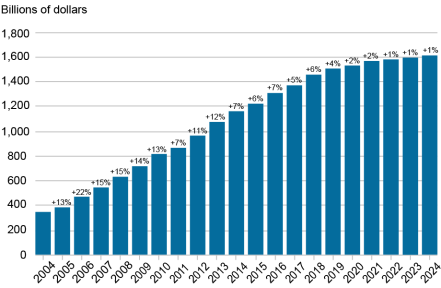
Notes: Each bar above plots the total outstanding student loan balance at the end of each year. Percentage point increase labels above each bar denote the annual growth rate in total outstanding student loans from the previous year.
The Disruption and Reversion of Repayment Trends due to the Pandemic Forbearance
The chart below, derived from Page 4 of the Student Loan Update, separates borrowers into four payment status categories: 1) those with loans that are all current and whose balance declined during the previous year, 2) those with loans that are all current and whose balance was the same or higher compared to a year prior, 3) those with at least one student loan more than 90 days past due, and 4) those in default. During the pandemic forbearance when payments weren’t required, the share of borrowers with flat or growing balances saw a sharp increase from 47.9 percent in 2019 to a peak of 72.7 percent in 2022, while the share of those with declining balances saw a corresponding decrease.
Since the resumption of federal student loan interest and payments in fall 2023, a larger share of borrowers had decreased balances, either by making payments or through various federal student loan forgiveness provisions. However, the share that have not reduced their balance remained elevated in 2024 at 63.2 percent. This elevated rate of flat or growing loans is likely driven by a combination of non-payment and to the large number of borrowers in administrative forbearance due to litigation over the SAVE repayment plan. Borrowers in the flat or growing balance category are disproportionately likely to have had a prior delinquency: 35.4 percent of individuals with flat or growing student loan balances in 2024 had a pre-pandemic delinquency compared to 19.8 percent of individuals with decreasing balances.
The Share of Borrowers with Growing or Stagnant Balances Remains Elevated Despite Resumption of Payments
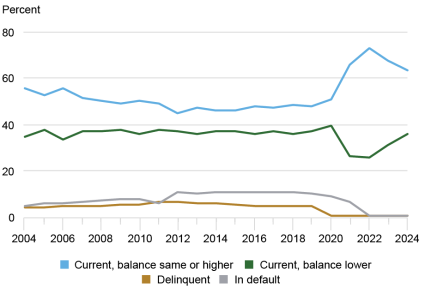
Note: The chart above breaks the total number of student loan borrowers in each year into four categories and plots the share of borrowers in each category. A borrower is represented by the green line in a particular quarter if all their student loans are current and the total outstanding balance declined over the previous year (including borrowers who ended with a zero balance). A borrower is represented by the blue line in a particular quarter if all their student loans are current, but the total outstanding balance increased or remained flat over the previous year (including borrowers who previously had a zero balance but originated loans in that year). A borrower is represented by the gold line if any of their student loans are 90 or more days past due but not in default. A borrower is represented by the gray line if they have at least one defaulted student loan.
The Mass Curing of Delinquency and Default via Forbearance
Additionally, the chart above shows that trends in delinquency and default were also disrupted after 2020. In the fourth quarter of 2004, only 9.4 percent of student loan borrowers had a student loan that was seriously delinquent or in default. This number reached its peak of 17.6 percent in 2012 and remained above 14 percent until the 2020 pandemic forbearance and the Fresh Start program eradicated delinquencies and defaults, respectively, for federally owned loans. As of the end of 2024, the share of delinquent or defaulted borrowers was 1.0 percent, composed only of borrowers holding private student loans or legacy federal loans owned by commercial lenders.
It is unclear whether these trends will revert to pre-pandemic levels now that supports have ended. Interest accrual on federal student loans resumed in August 2023 which will put upward pressure on aggregate balances. Required payments on federal student loans resumed in September 2023 which should put downward pressure on the growth in balances, but the Biden Administration created an on‑ramp for borrowers so that missed federal student loan payments would not adversely impact credit scores for one year. So, the strength of this downward pressure will depend on the number of borrowers making payments and the size of those payments. In the chart below, we update a chart from a previous Liberty Street Economics post showing monthly deposits for the Education Department at the U.S. Treasury, which are predominately student loan payments. The chart shows steadily increasing monthly deposits since the end of the on-ramp that are beginning to approach pre‑pandemic levels.
Monthly Deposits at Treasury Suggest Student Loan Payments Are Approaching Pre-Pandemic Levels
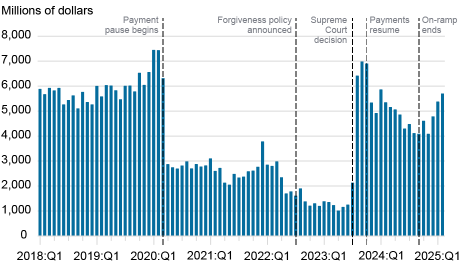
The on-ramp protecting student loan borrowers from negative credit reporting ended in September 2024 but since it takes at least 90 days of missed student loan payments to be reported delinquent, adverse credit reporting for delinquent federal student loans is only now beginning to appear on credit reports. In our companion post, we explore how the pandemic forbearance impacted the credit scores of student loan borrowers and how the return of adverse credit reporting will affect student loan borrowers.

Daniel Mangrum is a research economist in the Federal Reserve Bank of New York’s Research and Statistics Group.

Crystal Wang is a research analyst in the Federal Reserve Bank of New York’s Research and Statistics Group.
How to cite this post:
Daniel Mangrum and Crystal Wang, “Student Loan Balance and Repayment Trends Since the Pandemic Disruption,” Federal Reserve Bank of New York Liberty Street Economics, March 26, 2025, https://libertystreeteconomics.newyorkfed.org/2025/03/student-loan-balance-and-repayment-trends-since-the-pandemic-disruption/
BibTeX: View |


Disclaimer
The views expressed in this post are those of the author(s) and do not necessarily reflect the position of the Federal Reserve Bank of New York or the Federal Reserve System. Any errors or omissions are the responsibility of the author(s).
 RSS Feed
 Follow Liberty Street Economics