


This post presents an update of the economic forecasts generated by the Federal Reserve Bank of New York’s dynamic stochastic general equilibrium (DSGE) model. We describe very briefly our forecast and its change since December 2024. As usual, we wish to remind our readers that the DSGE model forecast is not an official New York Fed forecast, but only an input to the Research staff’s overall forecasting process. For more information about the model and variables discussed here, see our DSGE model Q & A.
The New York Fed model forecasts use data released through 2024:Q4, augmented for 2025:Q1 with the median forecasts for real GDP growth and core PCE inflation from the February release of the Philadelphia Fed Survey of Professional Forecasters (SPF), as well as the yields on 10-year Treasury securities and Baa-rated corporate bonds based on 2025:Q1 averages up to February 28. Starting in 2021:Q4, the expected federal funds rate (FFR) between one and six quarters into the future is restricted to equal the corresponding median point forecast from the latest available Survey of Market Expectations in the corresponding quarter. For the current projection, this is the January Survey of Market Expectations.
Output growth in the fourth quarter of 2024 was lower than the SPF had predicted in November—and therefore lower than the DSGE forecast, since the model used the SPF projection as a nowcast. In addition, the current SPF nowcast for GDP growth in Q1 is also lower than the DSGE prediction in December. The model attributes these forecast misses mainly to two factors: more restrictive monetary policy relative to expectations in December (recall that the forecasts were made before the December FOMC meeting) and cost-push shocks. These factors result in lower output growth projections for 2025 relative to December (1.2 versus 1.7 percent) but slightly higher growth in 2026 and 2027 (1.0 and 1.5 percent versus 0.4 and 0.9 percent, respectively) as the effect of the shocks on the level of economic activity is transitory. The probability of a recession, defined as four-quarter output growth falling below -1 percent over the next four quarters, has gone back up to 33 percent after decreasing to 24 percent in December.
In terms of assessing the policy stance, the model’s predictions for the short-run real natural rate of interest (r*) have increased relative to December (currently 2.4, 2.0, and 1.6 percent for 2025, 2026, and 2027, up from 2.1, 1.8, and 1.5 percent previously). The model’s projections for the policy rate have increased just as much as, if not more than, those for r*, especially for 2025, so that the monetary policy stance is effectively more restrictive, according to the model, than it was in December.
Core PCE inflation is expected to be higher in early 2025 relative to what was projected in December, mostly as the result of the aforementioned cost-push shocks, but lower for the rest of the year and thereafter, as the economy is expected to be weaker. As a result, inflation forecasts are the same as in December for 2025, but slightly lower for 2026 and 2027 (1.6 and 1.6 percent versus 1.8 and 1.9 percent in December, respectively). Note that the impact of tariffs is not incorporated into the DSGE model projections.
Forecast Comparison
| Forecast Period | 2025 | 2026 | 2027 | 2028 | ||||
|---|---|---|---|---|---|---|---|---|
| Date of Forecast | Mar 25 | Dec 24 | Mar 25 | Dec 24 | Mar 25 | Dec 24 | Mar 25 | Dec 24 |
| GDP growth (Q4/Q4) | 1.2 (-3.0, 5.5) | 1.7 (-3.4, 6.9) | 1.0 (-4.2, 6.3) | 0.4 (-4.7, 5.4) | 1.5 (-4.0, 6.9) | 0.9 (-4.6, 6.2) | 1.9 (-3.7, 7.5) | 1.4 (-4.3, 7.1) |
| Core PCE inflation (Q4/Q4) | 1.9 (1.3, 2.5) | 1.9 (1.2, 2.6) | 1.6 (0.7, 2.4) | 1.8 (0.9, 2.7) | 1.6 (0.6, 2.6) | 1.9 (0.8, 2.9) | 1.7 (0.6, 2.7) | 1.9 (0.8, 3.0) |
| Real natural rate of interest (Q4) | 2.4 (1.1, 3.7) | 2.1 (0.7, 3.5) | 2.0 (0.5, 3.5) | 1.8 (0.2, 3.3) | 1.6 (0.1, 3.2) | 1.5 (-0.1, 3.1) | 1.4 (-0.3, 3.1) | 1.3 (-0.4, 3.0) |
Notes: This table lists the forecasts of output growth, core PCE inflation, and the real natural rate of interest from the March 2025 and December 2024 forecasts. The numbers outside parentheses are the mean forecasts, and the numbers in parentheses are the 68 percent bands.
Forecasts of Output Growth
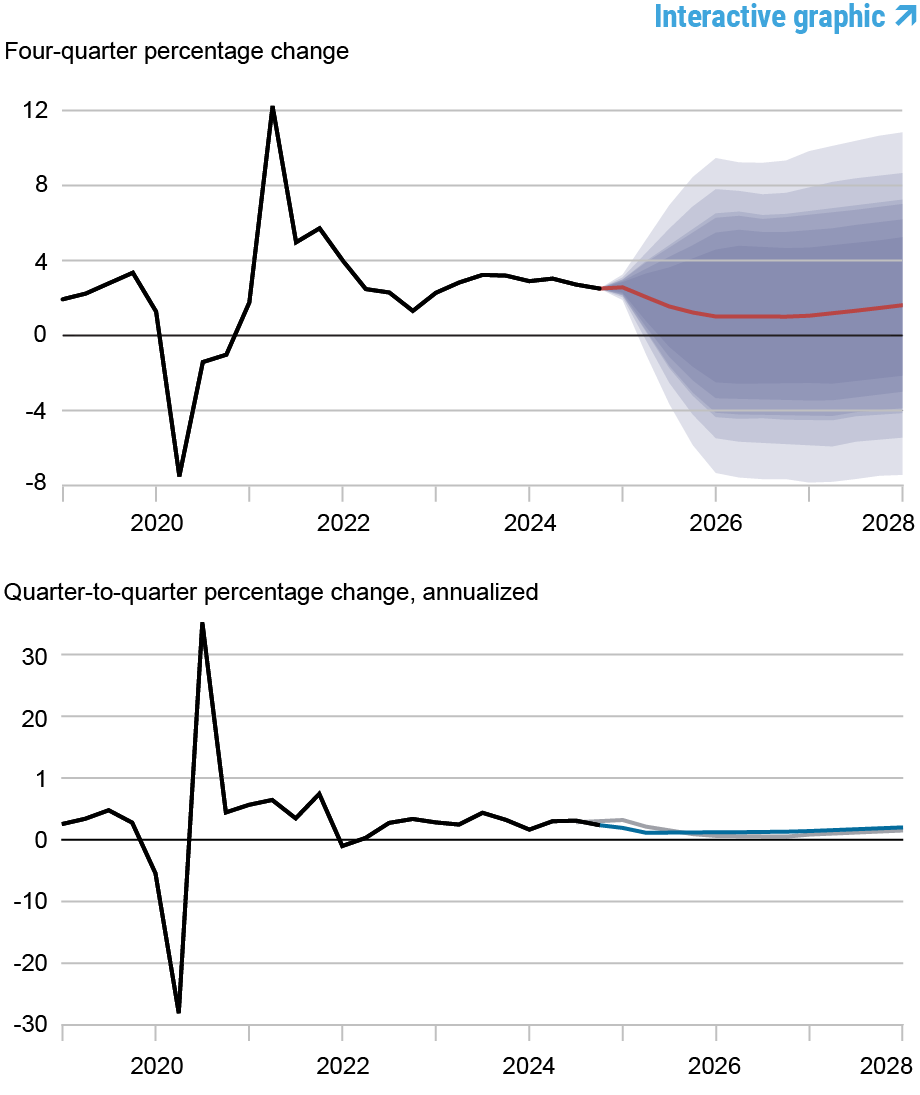
Notes: These two panels depict output growth. In the top panel, the black line indicates actual data and the red line shows the model forecasts. The shaded areas mark the uncertainty associated with our forecasts at 50, 60, 70, 80, and 90 percent probability intervals. In the bottom panel, the blue line shows the current forecast (quarter-to-quarter, annualized), and the gray line shows the December 2024 forecast.
Forecasts of Inflation
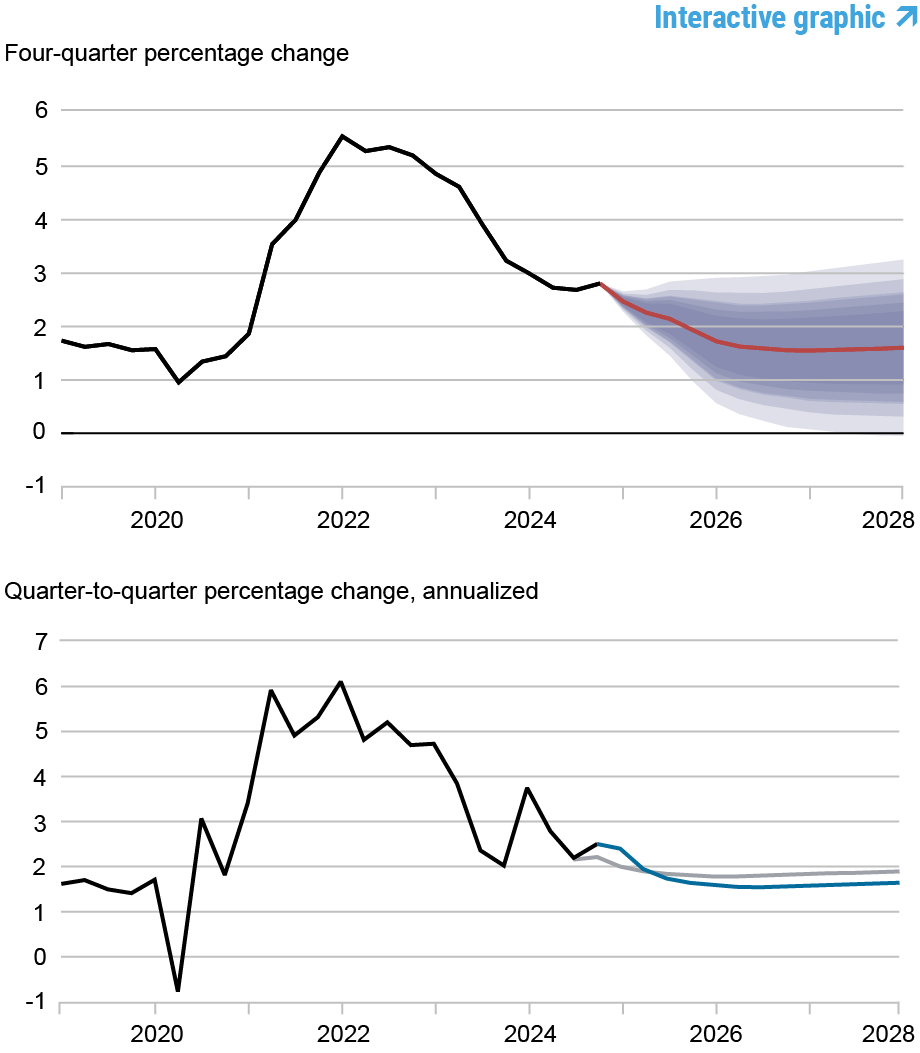
Notes: These two panels depict core personal consumption expenditures (PCE) inflation. In the top panel, the black line indicates actual data and the red line shows the model forecasts. The shaded areas mark the uncertainty associated with our forecasts at 50, 60, 70, 80, and 90 percent probability intervals. In the bottom panel, the blue line shows the current forecast (quarter-to-quarter, annualized), and the gray line shows the December 2024 forecast.
Real Natural Rate of Interest
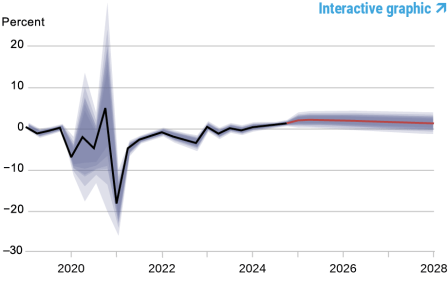
Notes: The black line shows the model’s mean estimate of the real natural rate of interest; the red line shows the model forecast of the real natural rate. The shaded area marks the uncertainty associated with the forecasts at 50, 60, 70, 80, and 90 percent probability intervals.

Marco Del Negro is an economic research advisor in the Federal Reserve Bank of New York’s Research and Statistics Group.

Ibrahima Diagne is a research analyst in the Federal Reserve Bank of New York’s Research and Statistics Group.

Pranay Gundam is a research analyst in the Federal Reserve Bank of New York’s Research and Statistics Group.

Donggyu Lee is a research economist in the Federal Reserve Bank of New York’s Research and Statistics Group.

Brian Pacula is a research analyst in the Federal Reserve Bank of New York’s Research and Statistics Group.
How to cite this post:
Marco Del Negro, Ibrahima Diagne, Pranay Gundam, Donggyu Lee, and Brian Pacula , “The New York Fed DSGE Model Forecast—March 2025,” Federal Reserve Bank of New York Liberty Street Economics, March 21, 2025, https://libertystreeteconomics.newyorkfed.org/2025/03/the-new-york-fed-dsge-model-forecast-march-2025/
BibTeX: View |


Disclaimer
The views expressed in this post are those of the author(s) and do not necessarily reflect the position of the Federal Reserve Bank of New York or the Federal Reserve System. Any errors or omissions are the responsibility of the author(s).
 RSS Feed
 Follow Liberty Street Economics