


A college degree was once viewed as a surefire ticket to a good job and a clear pathway for upward mobility. However, concerns about the rising cost of college and the struggles of recent college graduates to find good jobs have led many Americans to lose confidence in higher education. This shift in sentiment has become even more widespread since the pandemic, as opportunities and wages have grown for those without a degree as labor markets strengthened. Indeed, many have been left wondering whether college is still worth it. In a two-part blog series, we offer an economic perspective on the value of a college degree, updating our previous research and analysis. This first post examines the costs, benefits, and return for the typical college graduate. We estimate the return to college at 12.5 percent, a rate well above the threshold for a sound investment. Our second post looks beyond the typical graduate and finds a college degree might not be worth it for at least a quarter of college graduates.
Despite Doubts, College Still Provides a Healthy Return
To weigh the upfront costs of college against the lifetime benefits, we calculate the internal rate of return—a measure investors commonly use to gauge the profitability of different investments. We follow the methodology used in our previous studies, with one important exception. Rather than using standard regression methods to estimate lifetime earnings profiles for the average graduate, we utilize a quantile regression method to estimate earnings profiles and the rate of return for the median graduate. Because averages can be pulled up by particularly high wage earners, the median provides an estimate more in line with what the “typical” graduate could expect. Indeed, the rates of return we estimate here are generally a bit lower than our previous estimates based on averages. The chart below plots our estimates of the return to college for the median graduate since 1970.
The Return to College Remains Significant
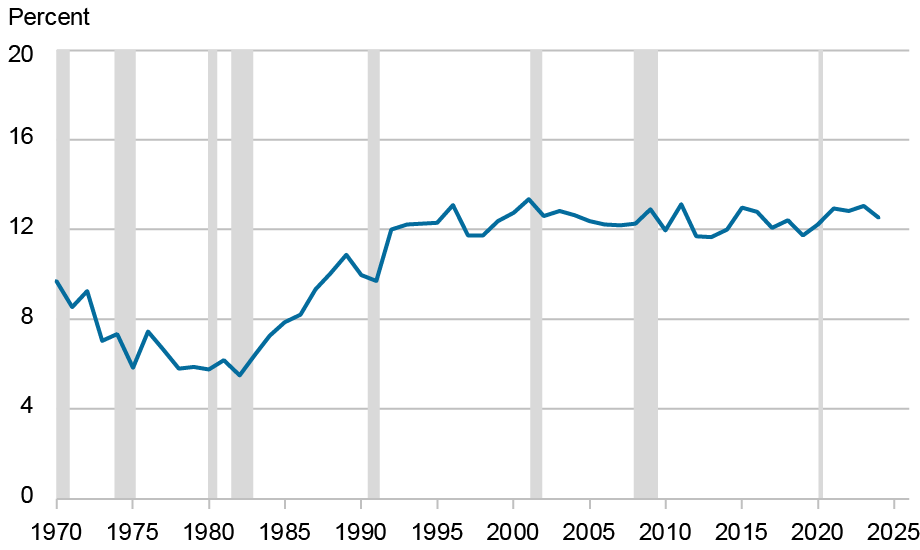
Note: Shaded areas indicate periods designated as recessions by the National Bureau of Economic Research.
After rising significantly in the 1980s and early 1990s, the return to college has held between 12 and 13 percent for the past three decades and was 12.5 percent in 2024—easily exceeding the threshold for a sound investment. Indeed, by comparison, the stock market has provided a long-term return of about 8 percent and bonds have returned around 4 percent. So, why has the return to college remained so high? It’s because while the cost of college has continued to rise, so have the benefits.
The Cost of College Continues to Rise, but Not for the Reason You Might Think
The economic costs of college include direct “out of pocket” costs as well as opportunity costs. Direct costs include tuition, fees, books, and supplies but do not include room and board, as those costs must be incurred whether one attends college or not. (However, room and board may be more expensive on campus, an issue we explore in our next post). The opportunity cost of college is the value of what one must give up while attending college, which essentially translates into forgone wages that could have been earned by working instead of attending school.
To measure the direct costs of college, we use data from the National Center for Education Statistics as well as the College Board. We estimate the “net price” of college by subtracting various forms of grant aid received by the average student from the “sticker price” of college (median direct cost measures are not available). Indeed, while the average published tuition at four-year colleges (public and private combined) was around $21,000 per year in 2024, the average student received nearly $15,000 in grants and other forms of aid from federal and state governments and the colleges themselves, as well as tax benefits. Taking this financial aid into consideration, the average net price of college, assuming it takes four years to earn a degree, totaled about $30,000 in 2024, as shown in the chart below. Indeed, after increasing through the mid-2010s, the direct out-of-pocket costs of college have come down as tuition has actually been falling in recent years after adjusting for inflation.
Direct “Out of Pocket” Costs of College Have Fallen, but Opportunity Costs Have Risen
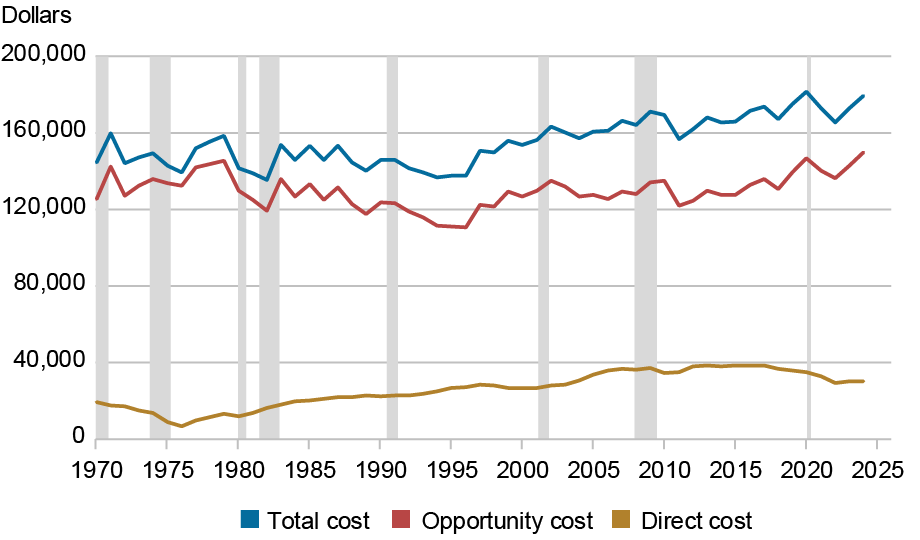
Notes: Shaded areas indicate periods designated as recessions by the National Bureau of Economic Research. Amounts are expressed in 2024 dollars.
Opportunity costs, however, have been rising—more than offsetting the decline in direct costs. To estimate the opportunity cost of college, we use the median wage earned by a high school graduate during the first four years of employment—a figure totaling $150,000 in 2024, dwarfing direct costs. Opportunity costs have generally been rising since the late 1990s, including the years before and after the pandemic when tight labor market conditions boosted the real wages of those without a college degree. Adding together direct costs and opportunity costs over four years yields the average total cost of a college degree, which increased from around $140,000 in the late 1990s to $180,000 in 2024.
The Benefits of College Remain Substantial
College graduates earn a substantial wage premium in the labor market compared to those with only a high school diploma, and this premium tends to grow over one’s career. Below we plot the median annual wages of college graduates compared to those with only a high school diploma, adjusted for inflation and demographic differences between the two groups. In recent years, the median college graduate with just a bachelor’s degree earned about $80,000, compared to $47,000 for the median worker with only a high school diploma. This means a typical college graduate earned a premium of over $32,000 per year, or about 68 percent—near its all-time high.
The College Wage Premium Remains Near Its All-Time High
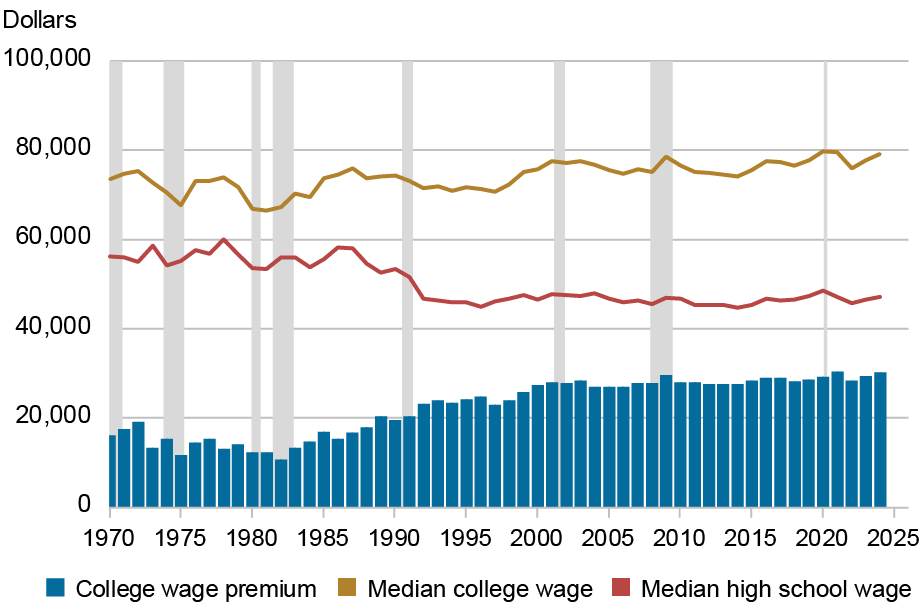
Notes: Shaded areas indicate periods designated as recessions by the National Bureau of Economic Research. Amounts are expressed in 2024 dollars.
Real wages for both groups have generally been rising over the past decade, as tight labor markets benefited high school graduates and college graduates. Indeed, median wages for college graduates increased more, rising 7 percent compared to 5 percent for high school graduates. This increase was a noteworthy change for high school graduates, who saw their median wages stagnate from 1994 to 2014, though it represented a continuing trend for college graduates, whose wages have been trending upward for three decades.
With the annual college wage premium at more than $30,000, it is easy to see why the return to college remains so substantial. Over an entire working life of more than forty years, such a premium adds up to a benefit well in excess of the costs.
Yes, College Is Still Worth It … At Least, for Most People
The typical college graduate earns a return that easily surpasses the benchmark for a sound investment. That said, there are a number of caveats to keep in mind with our back-of-the-envelope calculations. First, some of what we estimate as the benefit to college may not be a consequence of the knowledge and skills acquired while in school but rather could reflect innate abilities possessed by those who complete college. However, a number of studies that attempt to correct for this possibility find a similar return. In part, this is likely because in today’s labor market a college degree continues to serve as a gateway to professional occupations that offer better opportunities for wage growth over the life cycle. It is also important to keep in mind that our estimates apply to college graduates; those who start college but do not complete a degree incur at least some of the costs but enjoy far fewer benefits. And, importantly, our estimates are for the typical graduate paying the average costs over four years of school and earning the median college wage upon completion. But with half of college graduates earning a return below the median, and some paying higher costs, is college worth it for everyone? Find out in our next post.

Jaison R. Abel is head of Microeconomics in the Federal Reserve Bank of New York’s Research and Statistics Group.

Richard Deitz is an economic policy advisor in the Federal Reserve Bank of New York’s Research and Statistics Group.
How to cite this post:
Jaison R. Abel and Richard Deitz, “Is College Still Worth It?,” Federal Reserve Bank of New York Liberty Street Economics, April 16, 2025, https://libertystreeteconomics.newyorkfed.org/2025/04/is-college-still-worth-it/
BibTeX: View |


Disclaimer
The views expressed in this post are those of the author(s) and do not necessarily reflect the position of the Federal Reserve Bank of New York or the Federal Reserve System. Any errors or omissions are the responsibility of the author(s).
 RSS Feed
 Follow Liberty Street Economics
This report seems biased toward college as opposed to directly entering the workforce. How has high school wage decreased dramatically? How has the direct cost of college gone down? Tuition has increased and the cost for housing and food have all increased. The USA Today quotes your report essentially saying that college grads average $80k vs $47k for high school grads. This is misleading.
Thank you for posing your questions and comments, Michael and Jan. Indeed, our results should be interpreted as the return to graduating from college—those who start college but do not complete a degree incur at least some of the costs but enjoy far fewer benefits. Factoring dropout risk into our calculation would likely reduce the overall return to college by roughly 1½ percentage points. Understanding the compositional effect is complex. The increase in college attendance seen in the last few decades may result in a lower average wage for those with only a high school diploma, but it may well lower the average wage of college graduates as well. As a partial check on the sensitivity of our results to compositional changes in the aggregate ability pool, we re-estimated our baseline scenario including those with some college but no degree along with the high school group. Doing so reduced the return to college by about ½ percentage point. Importantly, while accounting for these kinds of considerations yields slightly different estimates of the return to college, doing so doesn’t change the big picture: college remains a good investment, at least for most people. Moreover, while there may be some reasons to think our estimates may overstate the return on a college degree, there are also some reasons why our estimates may actually be understated. Our analysis is based on a comparison of full-time wages between those with and without a college degree over the life cycle; however, those without a college degree are more likely to work part-time and are much more likely to experience periods of unemployment over their working lives. Also, we only consider those with a bachelor’s degree in our analysis. A growing proportion of college graduates have gone on to earn a graduate degree in recent decades. Our analysis does not factor in the option value of a bachelor’s degree for going on to earn a graduate degree, and the associated higher earnings.
Thank you for your comment, Suzanne, this is a good point. We agree that investing in a college education is an important way to build human capital and achieve upward mobility. Consistent with your observation, in other research, we have found that doing well in your coursework—holding constant college major—is an important factor in getting a good job after college. That said, as we show in our second blog post, choice of major also matters as there are important differences in the supply of and demand for skill in today’s economy. The extent to which the economic benefits of a college degree arise from human capital accumulation or is a signaling effect is an interesting but still open question.
Thank you for your comment, Nick. To estimate the out-of-pocket cost of college, we use the best information available from National Center on Education Statistics and The College Board and provide links to the source information in the post. While expensive colleges often make headlines, the out-of-pocket cost of college is not as high as many people might think. For example, the published “sticker price” of tuition to SUNY schools is roughly $3,500 per semester, and that’s before any financial aid. Further, these direct costs represent just a fraction of the total cost of college once opportunity costs are factored in, yet this is where the bulk of the attention has been focused. That said, some people do pay more than average for college and financial aid is not guaranteed. That’s why we consider these factors in our second blog post. Even quadrupling the out-of-pocket cost for four years of college—from $30,000 to $112,000—reduces the return from 12.5 percent to a still healthy 9.2 percent.
From your last paragraph: “It is also important to keep in mind that our estimates apply to college graduates; those who start college but do not complete a degree incur at least some of the costs but enjoy far fewer benefits.”
I think this caveat is so important it makes the entire conclusion misleading. The title of the article poses a question if “College Is Still Worth It” but answers a different question — “Is College Still Worth It For Those Who Finish Successfully?”.
This is akin to measuring the returns for startups and only looking at those which still exist after 4 years, that is only considering the success stories and ignoring all bankruptcies with negative returns.
Inclusion of all those who paid for college, whether finishing or not, would greatly improve the analysis and undoubtedly lower the investment return from attending college.
College is an investment and as a college professor of economics, I think a key oversight in these kinds of studies is the time and investment STUDENTS make during their time in college. Many students treat college as a consumption good, not an investment, and many students spend class time on their cell phones and/or do not attend class. I always tell my students a piece of paper does not make you more productive, rather the hard work and time you put into building skills matters. It is easier to blame majors than student effort.
In your assumptions “Taking this financial aid into consideration, the average net price of college, assuming it takes four years to earn a degree, totaled about $30,000 in 2024”. If we divide $30,000 by 8 semesters (4 year degree) you get $3750 costs per semester… I don’t think I’ve seen college charge that kind of money (a lot start at $5,000 per semester). This maybe applicable for a tech school that charge that amount. Basically your calculation is off because the inputs are wrong.
Isn’t there a methodological flaw in how you assess the ROI? It looks like you only count the (relatively high) benefits of those who graduate, ignoring the low benefits of those who attend but do not graduate (steadily at 40-45% over the last 40 years per NCES). This is like estimating return on equity investments while erasing all the bad quarters. You allude to this in your last paragraph. There, you also allude to another likely flaw: ignoring the compositional effect, in terms of the aggregate ability pool. When almost all high school graduates go to college, the pool of workers without college degree hollows out thus depressing the average wage of this group.