


One criticism of overdraft credit is that the fees seem borne disproportionately by low-income, Black, and Hispanic households. To investigate this concern, we surveyed around 1,000 households about their overdraft activity. Like critics, we find that these groups do tend to overdraft more often. However, when we control for respondents’ credit scores along with their socioeconomic characteristics, we discover that only their credit score predicts overdraft activity. While it’s not altogether surprising that credit constrained households overdrew more often, it’s noteworthy that socioeconomic characteristics did not help in predicting overdrafts. This more textured picture of overdraft activity helps inform the ongoing debate about overdraft credit and its users.
Background
Our overdraft data come from questions we added to the New York Fed’s Survey of Consumer Expectations conducted in February 2023. The SCE is an online survey of a nationally representative sample of roughly 1,100 U.S. household heads. We collected around 1,000 responses, with slightly more or less depending on the question. Respondents without a checking account, or who didn’t know if they had overdrawn their account, or whose financial institution did not offer overdraft credit, about 11 percent in total, were omitted from the analysis.
The chart below shows how often respondents said they had overdrawn their account in the previous twelve months. Nearly 80 percent reported zero overdrafts, with the remainder overdrawing with the frequency indicated. Given this distribution, we measure overdraft activity in two ways: first, by whether respondents ever overdrew, and second, by how frequently they overdrew, provided they ever did so. Overdraft frequency, the second measure, equals the weighted average number of overdrafts across the midpoints of the (non-zero) ranges below.
Share of Respondents by Overdraft Frequency
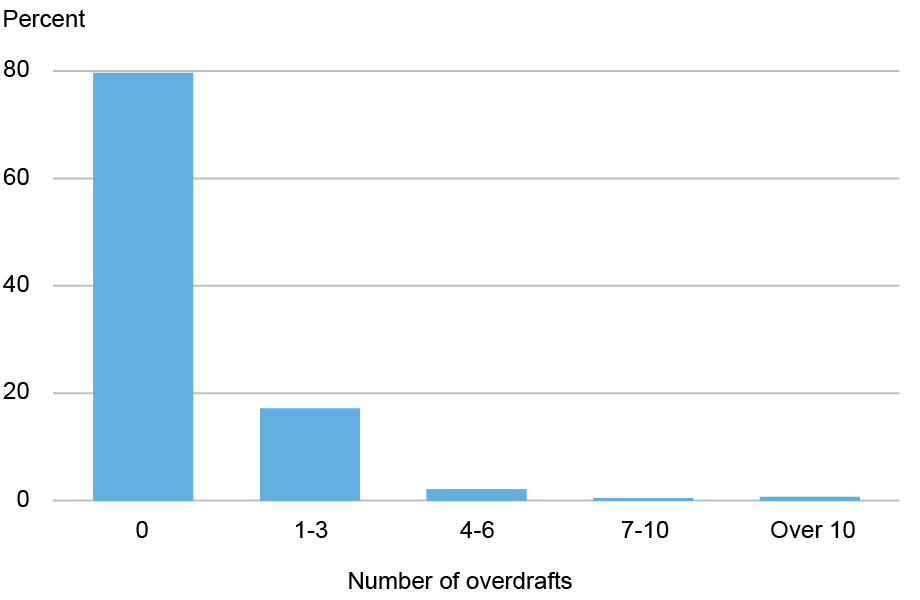
Note: The chart shows the shares of respondents reporting overdraft frequency in the intervals indicated.
Below we look at how respondents’ overdraft activity relates to their income, education, race, and credit score. We first study the individual (bivariate) relationships, and then the joint relationship, where we take all into account.
Income
We start by looking at how overdraft activity varies across respondent income. Lower-income households are usually found to be the most frequent overdrafters, but the chart below shows that the relationship depends on the overdraft measure; while the share of respondents that ever overdrafted tends to decline with household income, among those who overdraft, overdraft frequency is higher for respondents with incomes between $30,000 and $100,000 than for respondents with income under $30,000.
Lower-Income Households Are the Most Likely Overdrafters, but Not the Most Frequent
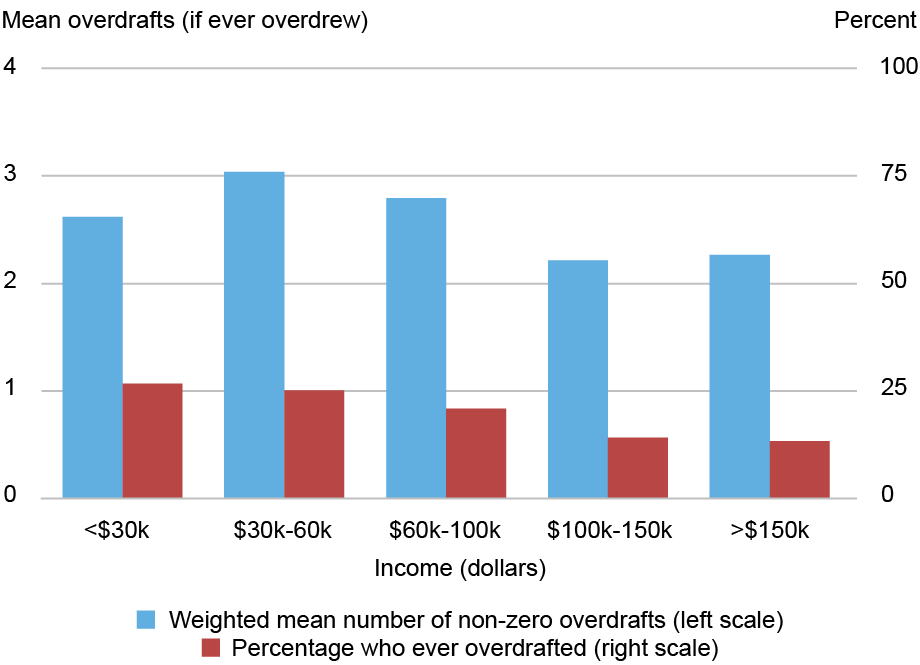
Notes: The red bars show the share of respondents in each income category who ever overdrafted over the past year (right scale). The blue bars show the mean number of overdrafts among respondents who ever overdrafted (left scale). The latter measure equals the weighted average number of overdrafts using the midpoints of the ranges shown in the first chart above.
Education
The chart below shows that overdraft activity also tends to vary by education, but here again, the relationship depends on the overdraft measure. The probability of ever overdrawing declines with educational attainment but not so with overdraft frequency; among those who overdraft, households with a high school diploma or less were the least frequent overdrafters while those with graduate or professional degrees were the most frequent.
Overdraft Activity by Education

Notes: The red bars show the share of respondents in each education category who ever overdrafted over the past year (right scale). The blue bars show the mean number of overdrafts among respondents who ever overdrafted (left scale). The latter measure equals the weighted average number of overdrafts using the midpoints of the ranges shown in the first chart above.
Race
Overdraft frequency also appears to vary by race, as the chart below shows. Black and Hispanic respondents were the most likely to have overdrawn in the previous year. By contrast, Asian respondents were the least likely to ever overdraw, but those who did, overdrew more frequently.
Overdraft Activity by Race

Notes: The red bars show the share of respondents in each race category who ever overdrafted over the past year (right scale). The blue bars show the mean number of overdrafts among respondents who ever overdrafted (left scale). The latter measure equals the weighted average number of overdrafts using the midpoints of ranges in the first chart above. “Asian,” “Black,” and “White” comprise respondents who identified as such and who did not identify as Hispanic. “Hispanic” includes any respondent who indicated as such. “Other” includes Native Americans and Pacific Islanders.
Credit Score
Because some depositors expressly use overdrafts as credit, it’s natural to explore how overdraft activity varies with credit score. The chart below shows that respondents with lower (self-reported) credit scores are substantially more likely to have ever overdrawn; those with scores below 620 were three and a half times more likely to ever overdraw than respondents with scores above 720. Note that overdrafts do not affect credit scores (unless depositors don’t repay), so it is unlikely that high overdrafts explain low credit scores. Overdraft frequency also tends to decline with higher credit scores, but only up to the middle range of scores (680-719).
Respondents with Lower Credit Scores Overdraw More Often

Notes: The red bars show the share of respondents in each credit score category who ever overdrafted over the past year (right scale). The blue bars show the mean number of overdrafts among respondents who ever overdrafted (left scale). The latter measure equals the weighted average number of overdrafts using the midpoints of ranges in the first chart above.
Putting It All Together
We’ve found that overdraft activity correlates with several socioeconomic characteristics, consistent with critics’ concerns. However, some characteristics may themselves be correlated, making it difficult to resolve which really matter. To get a more robust picture, we estimated two equations showing how each overdraft measure differs across characteristics, holding all others constant. The chart below summarizes the results. The circle corresponding to each characteristic shows the estimated difference in overdraft activity for each respondent category, relative to the baseline (see chart notes). The line through the circle shows the 90 percent confidence interval; if the line includes zero, the difference is not significantly different from zero.
Credit Scores Are Better Predictors of Overdrafts Than Socioeconomics

Notes: The circles in each panel show how each overdraft measure differs for each income, race, credit score, and education category indicated. The differences are relative to the following baselines: income > $150,000; whites; graduate and professional degree; credit score > 760. These estimates are based on regressions of each overdraft measure on all categories simultaneously. The lines through the circles are 90 percent confidence bands based on robust standard errors.
The left panel shows that only respondents’ credit score is significant in predicting whether they ever overdrew. Those with scores below 620 were over 50 percent more likely to ever overdraw than those with scores above 760 (right panel). Given their credit score, respondents’ income, race, and education do not predict whether they ever overdrew. In particular, Black, Hispanic, or low-income respondents were not significantly more likely to overdraw than white or high-income respondents with similar credit scores.
Credit scores are also the main predictor of overdraft frequency, as seen in the right panel. Income and race are both insignificant in predicting overdraft frequency. Education is insignificant as well, with one (surprising) exception; among those who overdraft, respondents with only a high school degree or less overdrew significantly less frequently than those with professional or graduate degrees and similar credit scores.
Takeaways
Our findings add nuance to the claim that overdraft fees are borne disproportionately by low-income and certain minority households. It would be more precise to say that overdraft fees are paid disproportionately by more credit constrained individuals, some of whom happen to be lower-income, Black, or Hispanic. In other words, credit risk, not socioeconomics, is the primary predictor of overdrafts.

Gabriel Leonard is a research analyst in the Federal Reserve Bank of New York’s Research and Statistics Group.

Donald P. Morgan is a financial research advisor in the Federal Reserve Bank of New York’s Research and Statistics Group.

Wilbert van der Klaauw is an economic research advisor in the Federal Reserve Bank of New York’s Research and Statistics Group.
How to cite this post:
Gabriel Leonard, Donald Morgan, and Wilbert van der Klaauw, “Who’s Paying Those Overdraft Fees?,” Federal Reserve Bank of New York Liberty Street Economics, May 28, 2025, https://libertystreeteconomics.newyorkfed.org/2025/05/whos-paying-those-overdraft-fees/
BibTeX: View |


Disclaimer
The views expressed in this post are those of the author(s) and do not necessarily reflect the position of the Federal Reserve Bank of New York or the Federal Reserve System. Any errors or omissions are the responsibility of the author(s).
 RSS Feed
 Follow Liberty Street Economics