


Deposits are often perceived as a stable funding source for banks. However, the risk of deposits rapidly leaving banks—known as deposit flightiness—has come under increased scrutiny following the failures of Silicon Valley Bank and other regional banks in March 2023. In a new paper, we show that deposit flightiness is not constant over time. In particular, flightiness reached historic highs after expansions in bank reserves associated with rounds of quantitative easing (QE). We argue that this elevated deposit flightiness may amplify the banking sector’s response to subsequent monetary policy rate hikes, highlighting a link between the Federal Reserve’s balance sheet and conventional monetary policy.
How Deposit Flightiness Has Changed Over Time
Existing research on deposit stability has focused on differences across deposit types. For example, wholesale and uninsured deposits have long been recognized as more prone to flight than retail and insured deposits. Our findings suggest that aggregate deposit flightiness also varies significantly over time.
To measure deposit flightiness, we examine how responsive depositors are to changes in deposit rates. Specifically, we estimate how much deposit flows into a bank change when the bank raises its deposit rate by 1 percentage point. As shown in the chart below, deposit flow sensitivity has fluctuated considerably over the past two decades. Depositors’ flow sensitivity increased following the 2008 financial crisis, declined in the mid-2010s, but rose sharply after the onset of the COVID-19 crisis. By early 2022, deposit flow sensitivity had reached record highs, meaning deposits were more likely than ever to respond to changes in interest rates just before the Federal Reserve began its rate hiking cycle.
Flow Sensitivity Rose Sharply Following Recent QE
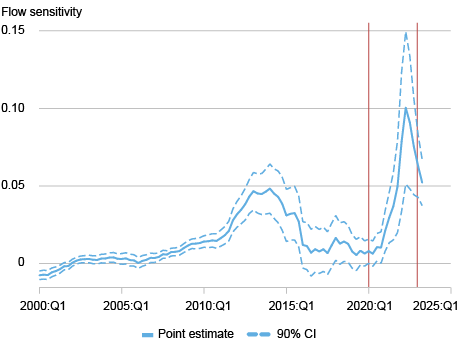
Notes: The chart illustrates the sensitivity of deposit flows to deposit rates in U.S. banks between 2000 and 2024. Dotted lines depict the 90% confidence interval of the flow sensitivity estimates. The outbreak of COVID-19 in March 2020 is marked by a vertical red line. The second line marks the end of the recent quantitative easing (QE) episode.
The non-Federal Reserve System authors of this work have access to anonymized deposit account-level data from a third-party data vendor that aggregates information from 1,500 depository institutions. We find very similar dynamics in investor-level deposit flow sensitivity with this highly granular data on individual depositors’ bank accounts. This account-level data also reveals that depositors who are more sensitive in moving deposits across their accounts at different banks also more readily transfer funds between their bank accounts and alternative investments, including nonbank financial institutions (NBFIs) like money market funds.
What Explains the Variation in Deposit Flightiness?
To understand the variation in deposit flightiness over time, we first note that not all deposits are equally stable. Some depositors that prioritize the safety and the payment convenience of deposits tend to keep their funds in banks regardless of interest rate changes or market fluctuations. Other depositors are less attached to bank deposits and more readily move their money at the first sign of better returns elsewhere. We show that at any given time, the investors who choose to hold bank deposits are less sensitive to interest rates than those who opt for alternative investments, such as money market funds. We further show that, when deposits flow into the banking system, they tend to be more rate-sensitive than the existing depositor base, making the overall deposit base more flighty.
The Role of Quantitative Easing
Over the past two decades, QE has significantly increased the level of bank deposits by injecting reserves into the banking system. We show that periods of rising reserves closely coincide with increases in deposit flightiness (see chart below).
Deposit Sensitivity Increased After Reserve Expansion
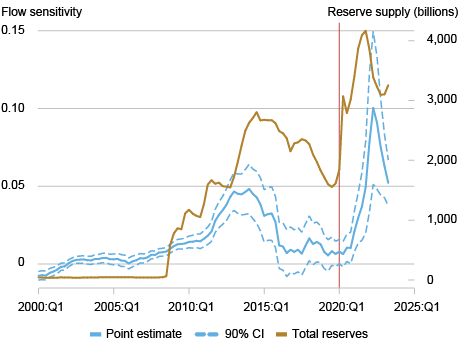
Notes: The chart illustrates the sensitivity of deposit flows to deposit rates in U.S. banks (left axis) imposed on the amount of Federal Reserve reserves (right axis) between 2000 and 2024. Dotted lines depict the 90% confidence interval of our flow sensitivity estimates. The outbreak of COVID-19 in March 2020 is marked by a vertical red line.
Why does QE lead to more flighty deposits? The key mechanism is that deposits created through reserve expansions disproportionately attract depositors who are more sensitive to interest rate changes than the existing depositors in the banking system (consider retail depositors vs. hedge funds that are brought in by the expansion of reserves). The influx of more rate-sensitive deposits raises the aggregate average flightiness of the deposit base. In other words, the marginal depositor has become flightier.
Using supervisory data on large U.S. banks, we further examine how depositor composition changed during and after the COVID-19 crisis. The next chart shows that deposits from nonfinancial corporations grew significantly more than retail deposits as reserves expanded from early 2018 to late 2021. These corporate deposits, which tend to be more volatile than retail deposits, subsequently declined at a faster rate once reserve balances started to shrink and interest rates began rising in 2022. The disproportionate growth and subsequent decline of corporate (as well as the highly volatile NBFI) deposits support the idea that changes in deposit composition over time play a crucial role in driving the dynamics of aggregate deposit flightiness.
Deposit Composition over Time

Notes: The chart illustrates monthly deposit levels by depositor type at large U.S. banks (indexed to January 2020). Depositor types are broken down into retail, NBFI, bank, large corporations, and small businesses based on Federal Reserve reporting requirements in Form 2052a.
Implications for Monetary Policy and Financial Stability
Our findings indicate that deposit composition and flightiness are not static but instead evolve in response to central bank policies. In particular, we uncover a novel interdependence between conventional and unconventional monetary policy: if policy rate hikes occur during periods when reserves and deposits are higher following QE, then the risk of deposit flight may be enhanced—how much depends on the way banks manage the risk and invest their assets. This interdependence between deposit flight risk and QE arises because the entities that provide much of the funds during QE-related deposit expansions tend to be more rate sensitive, amplifying the risk that these new depositors leave en masse to seek higher returns in response to subsequent rate hikes.

Kristian Blickle is a financial research advisor in the Federal Reserve Bank of New York’s Research and Statistics Group.
Jian Li is an assistant professor of business at Columbia Business School.
Xu Lu is an assistant professor of finance and business economics in the Michael G. Foster School of Business at University of Washington.
Yiming Ma is an associate professor of business at Columbia Business School.
How to cite this post:
Kristian Blickle, Jian Li, Xu Lu, and Yiming Ma, “The Rise in Deposit Flightiness and Its Implications for Financial Stability,” Federal Reserve Bank of New York Liberty Street Economics, July 10, 2025, https://libertystreeteconomics.newyorkfed.org/2025/07/the-rise-in-deposit-flightiness-and-its-implications-for-financial-stability/
BibTeX: View |


Disclaimer
The views expressed in this post are those of the author(s) and do not necessarily reflect the position of the Federal Reserve Bank of New York or the Federal Reserve System. Any errors or omissions are the responsibility of the author(s).
 RSS Feed
 Follow Liberty Street Economics