


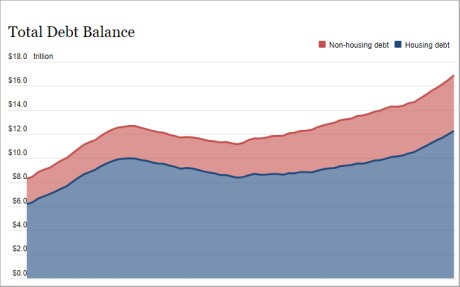
Debt balances continued to march upward in the second quarter of 2025, according to the latest Quarterly Report on Household Debt and Credit from the New York Fed’s Center for Microeconomic Data. Mortgage balances in particular saw an increase of $131 billion. Following a steep rise in home prices since 2019, several housing markets have seen dips in prices and concerns were sparked about the state of the mortgage market. Here, we disaggregate mortgage balances and delinquency rates by type and region to better understand the landscape of the current mortgage market, where any ongoing risks may lie, regionally and by product.
Note: The Quarterly Report and this analysis are based on the New York Fed Consumer Credit Panel, which is drawn from anonymized Equifax credit reports.
Mortgage Balance Composition
As of June 2025, total outstanding mortgage balances in the United States stood at $12.94 trillion. Loans securitized by government-sponsored enterprises (GSEs) like Fannie Mae and Freddie Mac continue to dominate the market, comprising around 52 percent of all balances at roughly $6.5 trillion. Government-backed loans, such as those insured by the Federal Housing Administration (FHA) or Department of Veterans Affairs (VA), account for 19 percent or $2.5 trillion. FHA loans are designed for first-time and lower-income buyers and make up 12 percent of balances, while VA loans that are available to U.S. military veterans comprise 8 percent.
Mortgage Balances Continue to Climb
The composition of total mortgage balances by type has stayed mostly stable since 2019. Other loans, shown in teal in the chart below, are comprised by a blend of loans, including loans held on bank portfolios as well as private label securitized loans. The more recent cross-section of “other” loans would be overwhelmingly portfolio loans, particularly jumbo loans that cannot be sold to the GSEs. The bulk of the loans in the “other” category in the earlier cross sections of the chart would likely have been comprised of the large volume of subprime loans that had been securitized on the private market.
Total Mortgage Balance Outstanding by Investor Type
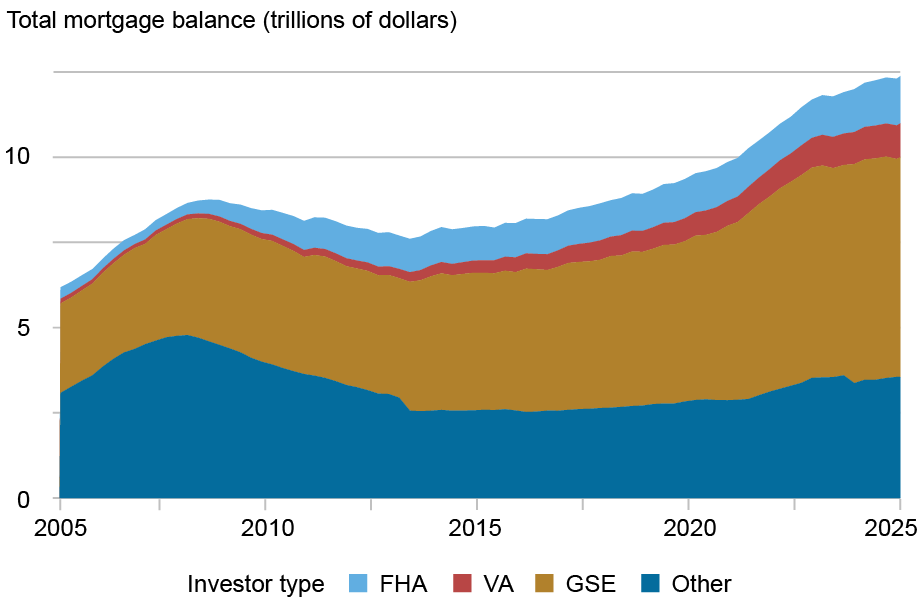
Note: Other includes mortgages held on portfolio, private label securities, and otherwise unnarrated loans.
New Delinquencies
Mortgage delinquency rates have risen modestly overall, although they remain low by historical standards. However, when we split mortgage balances by their underlying investor types, we note substantial heterogeneity. FHA loans, shown in blue in the chart below, have historically had higher delinquency rates—as an outcome of their mission to expand homeownership to new homeowners. These mortgages have recently seen the steepest rise in delinquency rates, with transitions into 30 days past due exceeding 4 percent quarterly. In a way, the current higher flow delinquency rates are offsetting the artificially low flow delinquency rates during the pandemic.
Quarterly New Delinquencies Have Risen Among FHA Mortgages but Remain Low and Stable for Other Types
Transition into delinquency (percent)
Note: 4-quarter moving average.
FHA Mortgages Comprise a Disproportionately Large Share of Delinquent Balances in 2025:Q2
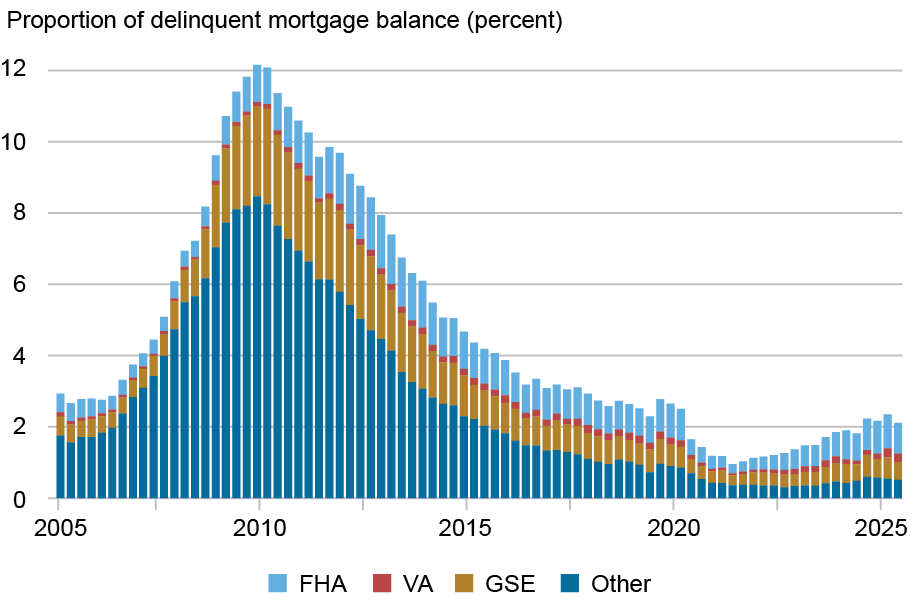
We next consider the actual dollar share of mortgages that are delinquent broken out by mortgage type. Currently, 2.1 percent of mortgage balances are 30 or more days past due, which is slightly below pre-pandemic levels in 2019:Q1. In 2025:Q2, GSE loans make up more than half of all mortgage debt, but less than a quarter of delinquent mortgages. On the other hand, FHA loans make up 38 percent of 30+ day delinquent balances despite constituting only 12 percent of total balances. This is a larger proportion of delinquent balances compared to before the pandemic, when FHA loans made up only 30.5 percent of delinquent balances in 2019:Q1. A look at the historic data shows that the markedly elevated levels observed in the teal bars prior to 2010 in the chart above align with the predominance of subprime and Alt-A mortgages in that category.
Quality of Newly Originated Mortgages Remains Solid, Even Among FHA Borrowers
Mean origination credit score, annual
Mortgage underwriting standards remained strict and average credit scores remained near historical highs even during the surge in homebuying in the pandemic-era. Credit scores at origination for GSE and other loans are the highest of all loan types and remain elevated at an average of 774. FHA loans, which typically have lower credit scores at origination, are showing average credit scores of new borrowers around 700. This score is near long-term highs, even as home prices and demand have surged upward over the past five years.
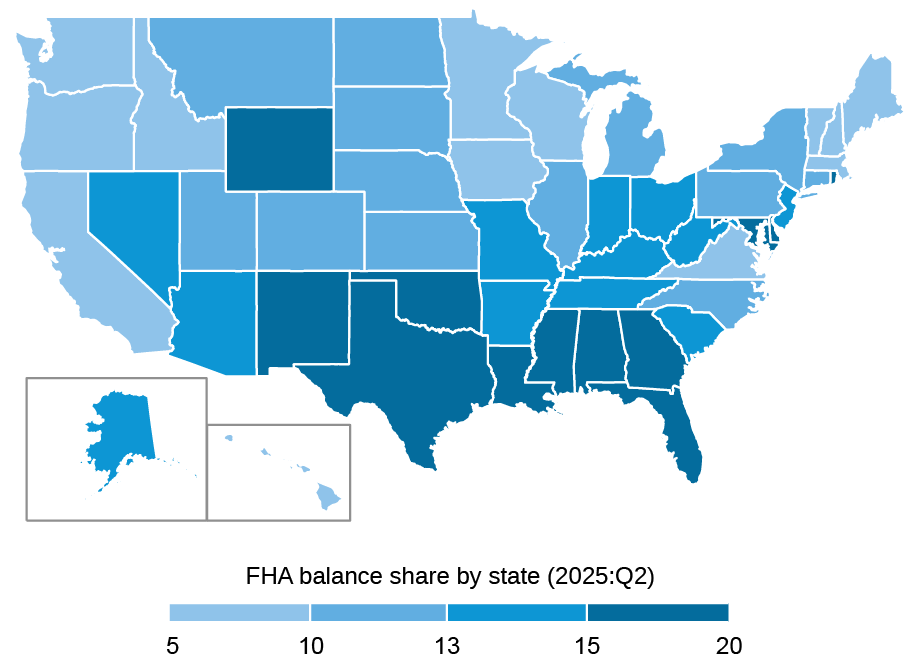
Where Are the FHA Borrowers?
Looking at geographic concentrations of loans, recent data indicate that a higher proportion of mortgage balances are delinquent in many of the southern states and Puerto Rico. We also note that a higher proportion of mortgage balances are FHA loans in the southern states. Notably, about 20 percent of mortgage balances in Oklahoma, Mississippi, and Puerto Rico are FHA loans, almost double the national average of 11 percent. Historically, we see that higher delinquency rates coincide with a higher share of FHA loans across states.
FHA Mortgages Are More Concentrated in the Southeast
Conclusion
The picture of the U.S. mortgage market is very different today than it was in 2008, when a substantial portion of outstanding mortgage balances consisted of non-GSE mortgages. These mortgages were particularly vulnerable to default, and delinquency rates surged after home prices began to decline. This was largely due to their lower credit quality and higher loan-to-value ratios, among other factors. By contrast, today’s mortgage landscape is marked by more prudent lending practices, and credit quality has improved. The average credit score for mortgages at origination in 2025 was 22 points higher among GSE loans compared to 2008, and FHA loans were 38 points higher. Further, outside of FHA, mortgages generally require lower loan-to-value ratios.
This longer-term improvement in quality has resulted in lower delinquency rates. While home prices have only declined slightly, there is some risk that a continued decline in home prices may add pressure should more borrowers find themselves underwater. Some of this pressure may be more relevant among FHA borrowers. FHA loan products allow for a smaller down payment at origination. The weakening performance among these borrowers may reflect rising financial pressure amid softening home prices, especially considering the preceding pandemic period of artificially low delinquency rates.
Mortgages are a financial tool that has historically helped American households bridge into homeownership and to build wealth, and the mortgage market remains the largest and most important credit market for American households. The recent uptick in mortgage delinquency seems to be concentrated among FHA borrowers, however, mortgage performance remains very solid when viewed in light of the twenty-year history of our data. Still, with the unusual dynamics of home prices in the last five years, many eyes are on mortgage performance, and we will continue to monitor this important market.

Andrew F. Haughwout is deputy research director in the Federal Reserve Bank of New York’s Research and Statistics Group.

Donghoon Lee is an economic research advisor in the Federal Reserve Bank of New York’s Research and Statistics Group.

Jonathan Lee is a research analyst in the Federal Reserve Bank of New York’s Research and Statistics Group.

Joelle Scally is an economic policy advisor in the Federal Reserve Bank of New York’s Research and Statistics Group.

Wilbert van der Klaauw is an economic research advisor in the Federal Reserve Bank of New York’s Research and Statistics Group.
How to cite this post:
Andrew F. Haughwout, Donghoon Lee, Jonathan Lee, Joelle Scally, and Wilbert van der Klaauw, “A Check‑In on the Mortgage Market,” Federal Reserve Bank of New York Liberty Street Economics, August 5, 2025, https://libertystreeteconomics.newyorkfed.org/2025/08/a-check-in-on-the-mortgage-market/
BibTeX: View |


Disclaimer
The views expressed in this post are those of the author(s) and do not necessarily reflect the position of the Federal Reserve Bank of New York or the Federal Reserve System. Any errors or omissions are the responsibility of the author(s).
 RSS Feed
 Follow Liberty Street Economics
Valuable insights here—it’s great to see the New York Fed diving into mortgage market dynamics. As the sector continues evolving, I’ve noticed that operational automation and AI-driven tools are playing an increasingly important role behind the scenes in maintaining efficiency and accuracy. Thanks for spotlighting these critical trends.
Hi Maria, The chart data has been added to the post.
Very useful analysis. Can you share the data behind charts.