


The end of the Great Recession marked the beginning of the longest economic expansion in U.S. history. The Great Recession, with its dramatic housing bust, led to a wave of home foreclosures as overleveraged borrowers found themselves unable to meet their payment obligations. In early 2009, the New York Fed’s Research Group launched the Consumer Credit Panel (CCP), a foundational data set of the Center for Microeconomic Data, to monitor the financial health of Americans as the economy recovered. The CCP, which is based on anonymized credit report data from Equifax, gives us an opportunity to track individuals during the period leading to the foreclosure, observe when a flag is added to their credit report and then—years later—removed. Here, we examine the longer-term impact of a foreclosure on borrowers’ credit scores and borrowing experiences: do they return to borrowing, or shy away from credit use and homeownership after their earlier bad experience?
Foreclosure Notations on Credit Reports
Foreclosures are associated with a flag on the credit reports of mortgage borrowers, which is similar to what happens after an individual files bankruptcy. Information related to foreclosures (“foreclosure notes”) may not remain on a credit report for more than seven years, as stipulated in the Fair Credit Reporting Act (FCRA). These negative notes on credit reports are visible to creditors and limit the borrowers’ access to credit by reducing their credit scores and enabling lenders to decide whether to lend to those who previously foreclosed. The FCRA guidance protects borrowers by providing a finite window during which their access to credit may be limited due to their past delinquency and default. Because they stick for seven years, the flags accumulated during the Great Recession were slated to remain for years after it ended. In the chart below, we show (in the red line) the number of consumers with new foreclosures observed each year. The blue bars show just how many people had a foreclosure note on their credit report; by 2016, the number of individuals with a foreclosure mark had finally begun to return to more normal levels as the flags aged off.
Foreclosure Marks on Credit Reports Were Rare by 2023
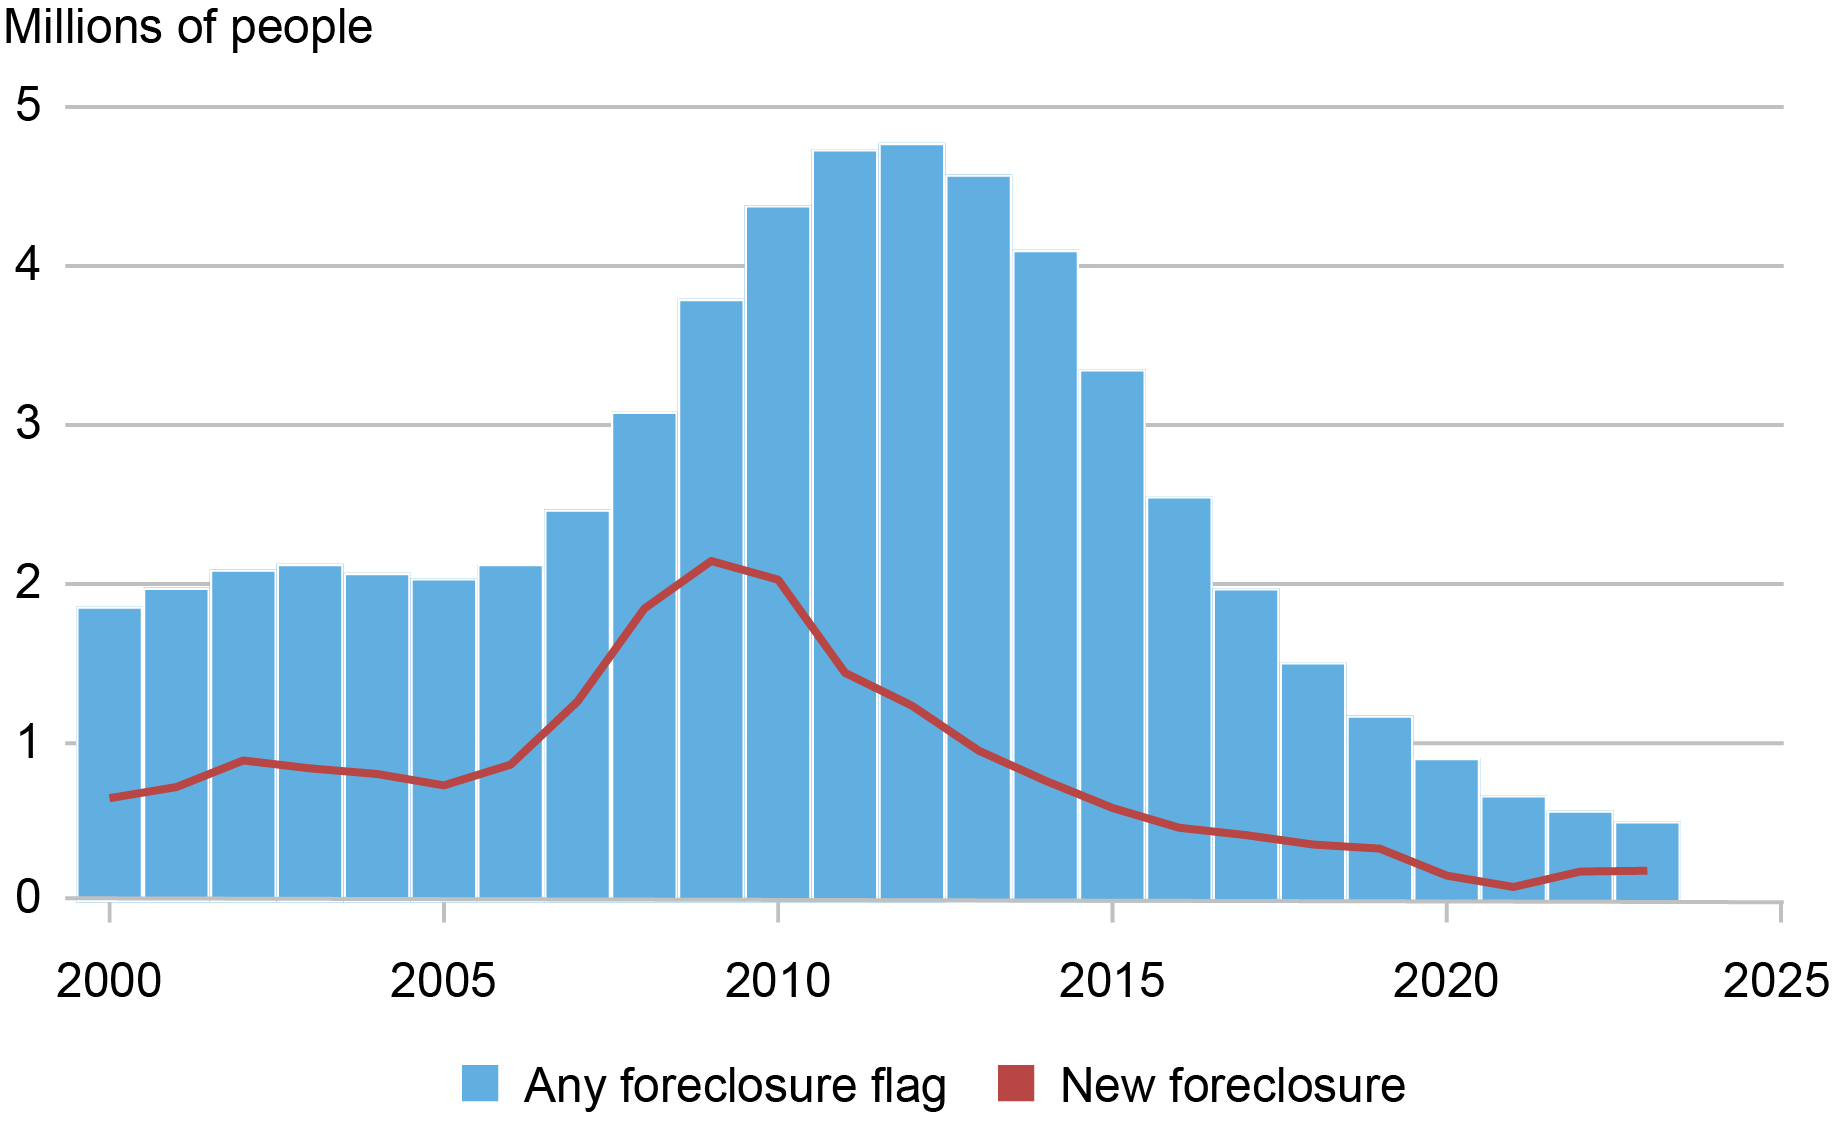
Notes: Data are reported at an annual frequency.
Foreclosures reached record levels during the Great Recession. Between 2000 and 2006, there were, on average, under 700,000 foreclosures initiated annually. But between 2007 and 2013, that number more than doubled—we observe approximately 1.8 million foreclosures per year. The highest level was observed in 2009, with about 2 million new foreclosures initiated. The cumulative effect was 4.8 million consumers with a foreclosure note on their credit report by 2011.
Impact on Credit Score
In the chart below, we look at the average credit score of the individuals who had a flag added to their credit report during 2008. Along the horizontal axis, we show the quarters before and after the flag was added, with zero being the quarter that the flag first appeared. The foreclosure note generally lasts for about twenty-six quarters, so one thing that’s visible in the chart is that the note itself isn’t necessarily what causes a borrower’s credit score to decline. The period of delinquency before the foreclosure starts results in a 150-point credit score drop on average and with an average score falling below 500; the addition of the flag itself is associated only with a small additional decline in the score. The average credit score steadily improves from that point as the foreclosure note ages, eventually increasing by an additional average of 20 points when the foreclosure note drops off.
Credit Score Declines before the Foreclosure Flag Appears
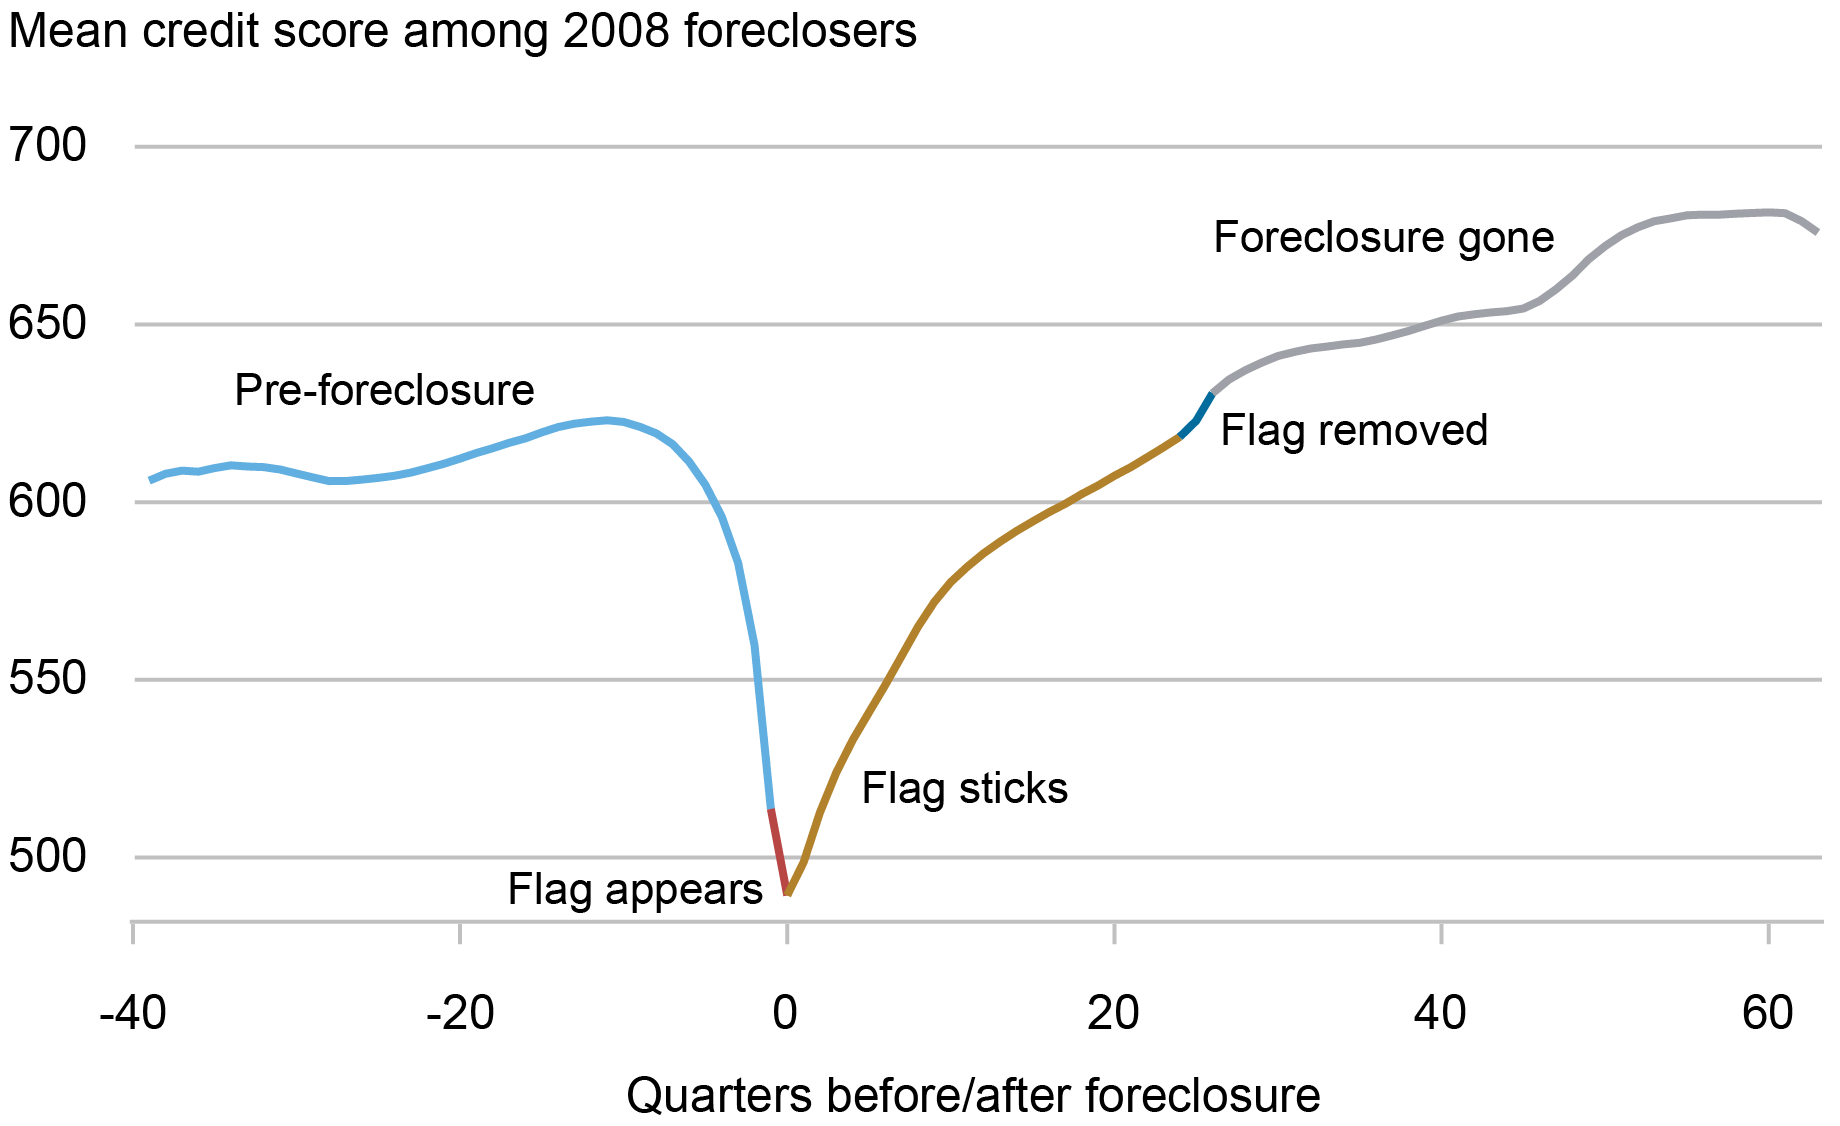
Note: Credit score is Equifax Risk Score 3.0.
Longer Term, How Have These Borrowers Fared?
It is well-documented that foreclosures during the Great Recession were concentrated in certain parts of the country, such as the so-called “sand states.” We additionally find those who experienced foreclosure tended to be younger—in fact, over 41 percent of these borrowers were under 40 years old and had newly entered homeownership during the frothy early-2000s housing market. Homeowners who were foreclosed on in 2008 also tended to be disproportionately from lower-income zip codes; 41 percent of those who foreclosed in 2008 were from the lowest-income quartile that comprises 25 percent of the population and an even smaller share of the home-owning population.
This episode of serious financial distress occurred for many borrowers as they entered their prime working years, leaving a persistent scar on their credit reports. The flags would have fallen off the credit reports of those who experienced a 2008 foreclosure action by 2015, and 2023 marked an additional nine years since then. In the following section, we explore how these borrowers are faring now, and whether they’ve caught up to their peers who didn’t lose their homes.
Because most borrowers find themselves with deep-subprime credit scores after foreclosure, getting new credit is difficult. Borrowers ease into getting new loans about four years after getting a flag, which is on average about when their score approaches their pre-distress score. For this group, new mortgage borrowing in particular is very slow, partially reflecting tightened credit standards.
Because borrowers who experienced foreclosure tended to be different in measurable ways from the average mortgage holder, we create a comparison group for these borrowers by selecting 2008 mortgagors who never foreclosed, despite having similar characteristics that put them at a higher risk of foreclosing based on their age, credit history, and geographic location. This group might include, for example, a younger mortgage borrower who had a low credit score and lived in a lower-income area in 2005. The fact that they did not foreclose on their home in 2008 may have been because they were able to avoid job loss, or could rely on greater financial support from family or friends.
In the chart below, we depict the evolution of credit scores among those who foreclosed and similar borrowers who did not. We additionally provide the average credit score of the overall population of mortgage borrowers who did not experience foreclosure, shown in the dotted gold line. Notably, borrowers who did foreclose—shown in blue—have credit scores that were considerably lower than mortgage borrowers who never foreclosed even before the foreclosure event (dotted gold line), as subprime borrowers were a substantial share of the initial wave in 2008. Yet, when we compare these borrowers with the selected peer group, shown in red, we see that even sixteen years out, the gap between the median credit scores of these two groups, while substantially narrowed, has remained persistent. And when we compare these borrowers to the 2008 mortgage borrowers who never foreclosed, we see that, despite an overall improvement in credit scores with age, there continues to be a significant gap between their median credit scores.
Foreclosed Borrowers’ Credit Scores Rebound, but Have Not Caught Up to Peers’
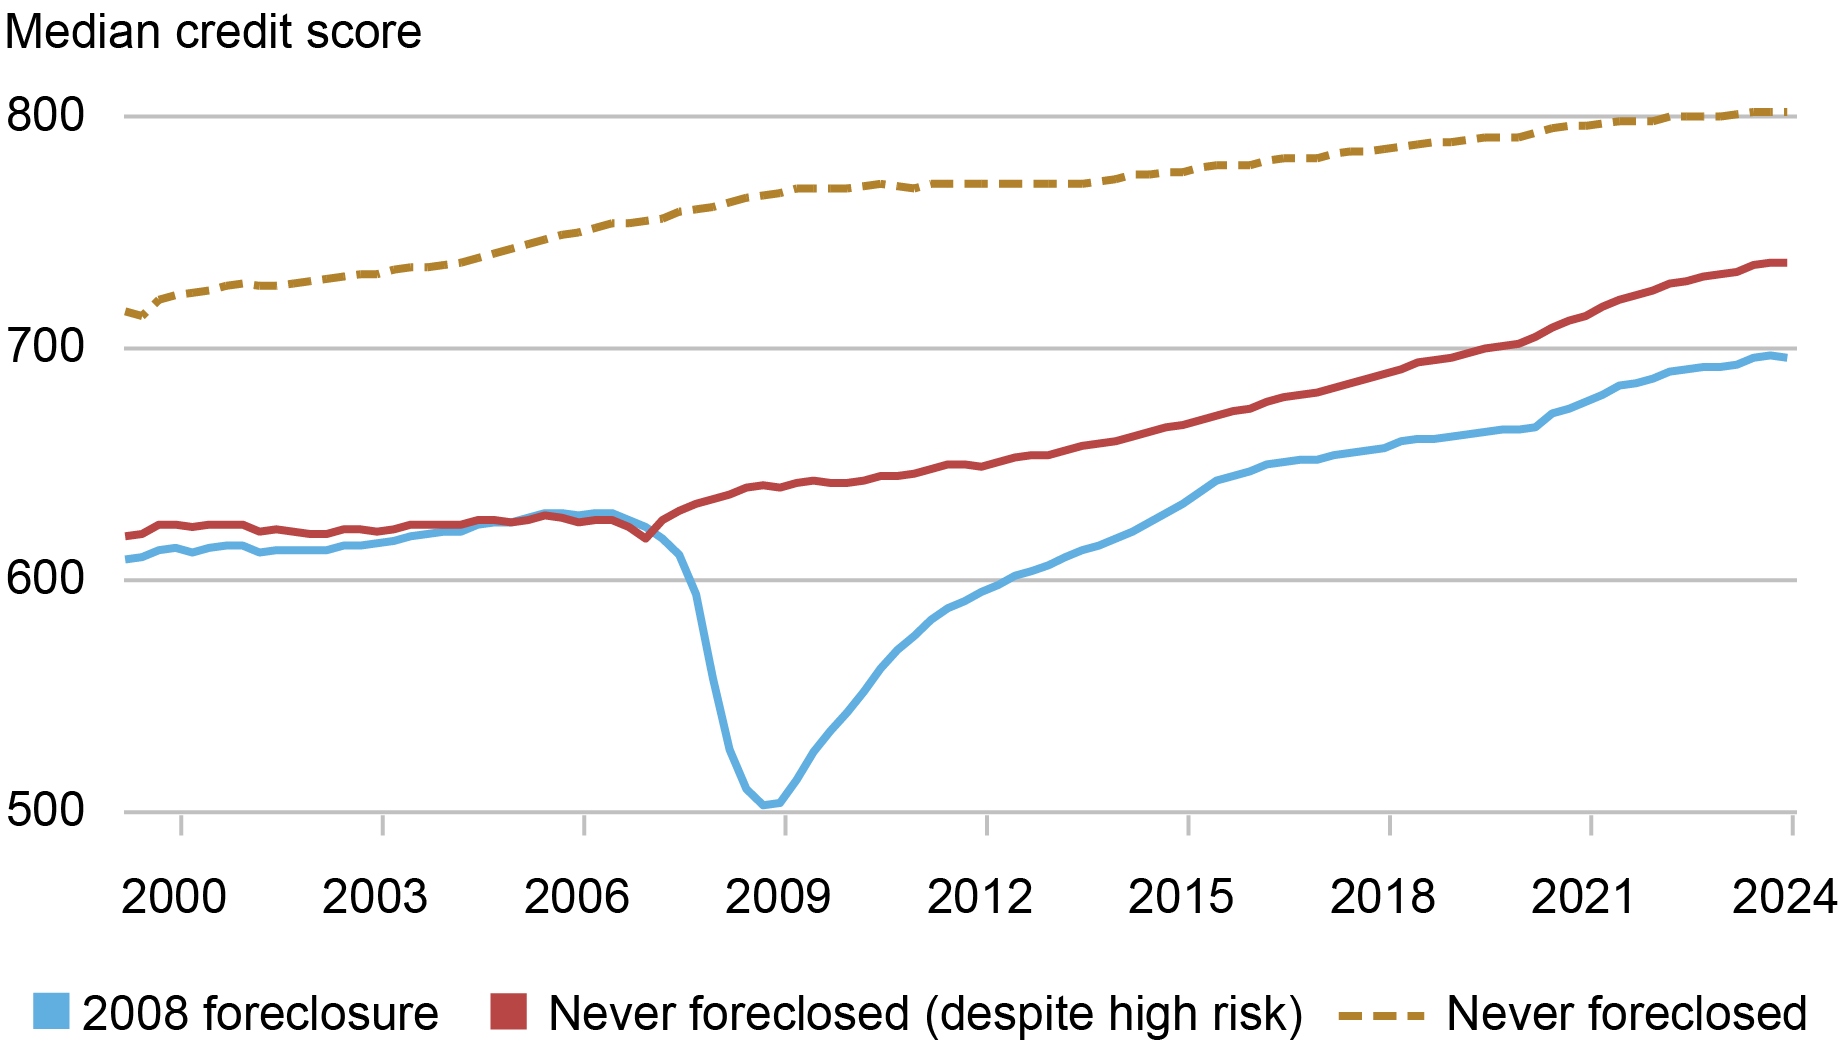
Note: Credit score is Equifax Risk Score 3.0.
As seen in the charts below, these gaps persist even within age groups, which is somewhat surprising for the younger borrowers who were at the early part of their financial lives.
The Experience of Foreclosure Has a Long-Lasting Impact for Younger and Older Borrowers
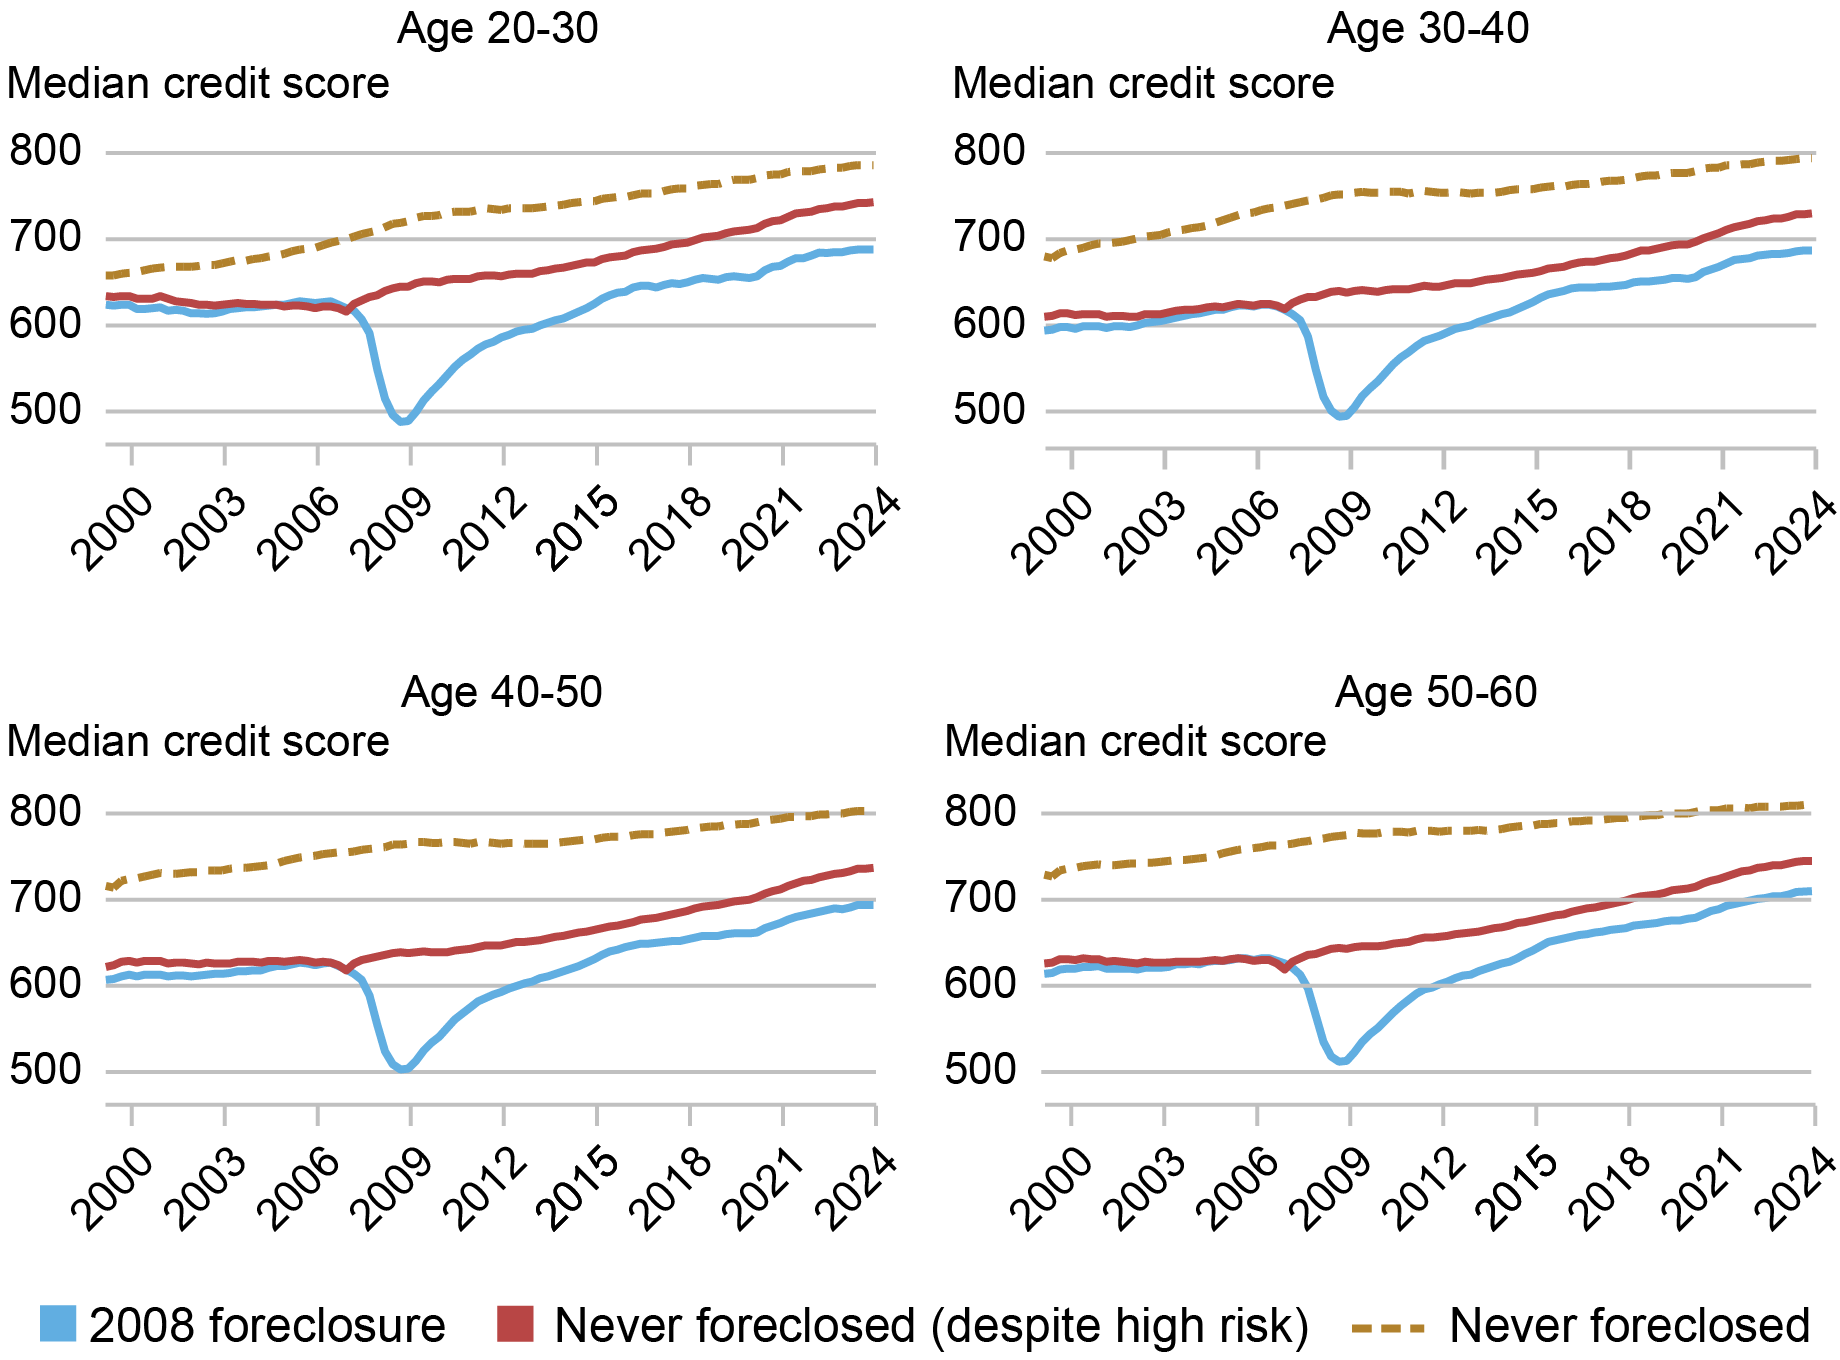
Note: Credit score is Equifax Risk Score 3.0.
We next consider whether foreclosed borrowers were able to get another mortgage. There is some evidence of financial life cycles driving the return to homeownership, which we define here as the presence of a mortgage on the credit report. For the youngest borrowers—those who were under 30 at their time of foreclosure—a sizeable share has returned to owning a home, although their homeownership rates remain far below those of their peers, as illustrated in the upper panels of the chart below. For older borrowers, the picture is somewhat different: the borrowers who experienced foreclosure see a reduction in homeownership following the foreclosure sequence (but not to zero as many that were foreclosed on had multiple mortgages). However, there is very little pickup in the following years. By contrast, their peers, shown in the dotted gold and red lines in the bottom right panel of chart below, show a gradual reduction in this measure of homeownership, suggesting some combination of a payoff or an exit from homeownership.
Borrowers Who Foreclosed in 2008 Have Significantly Lower Homeownership Rates Now
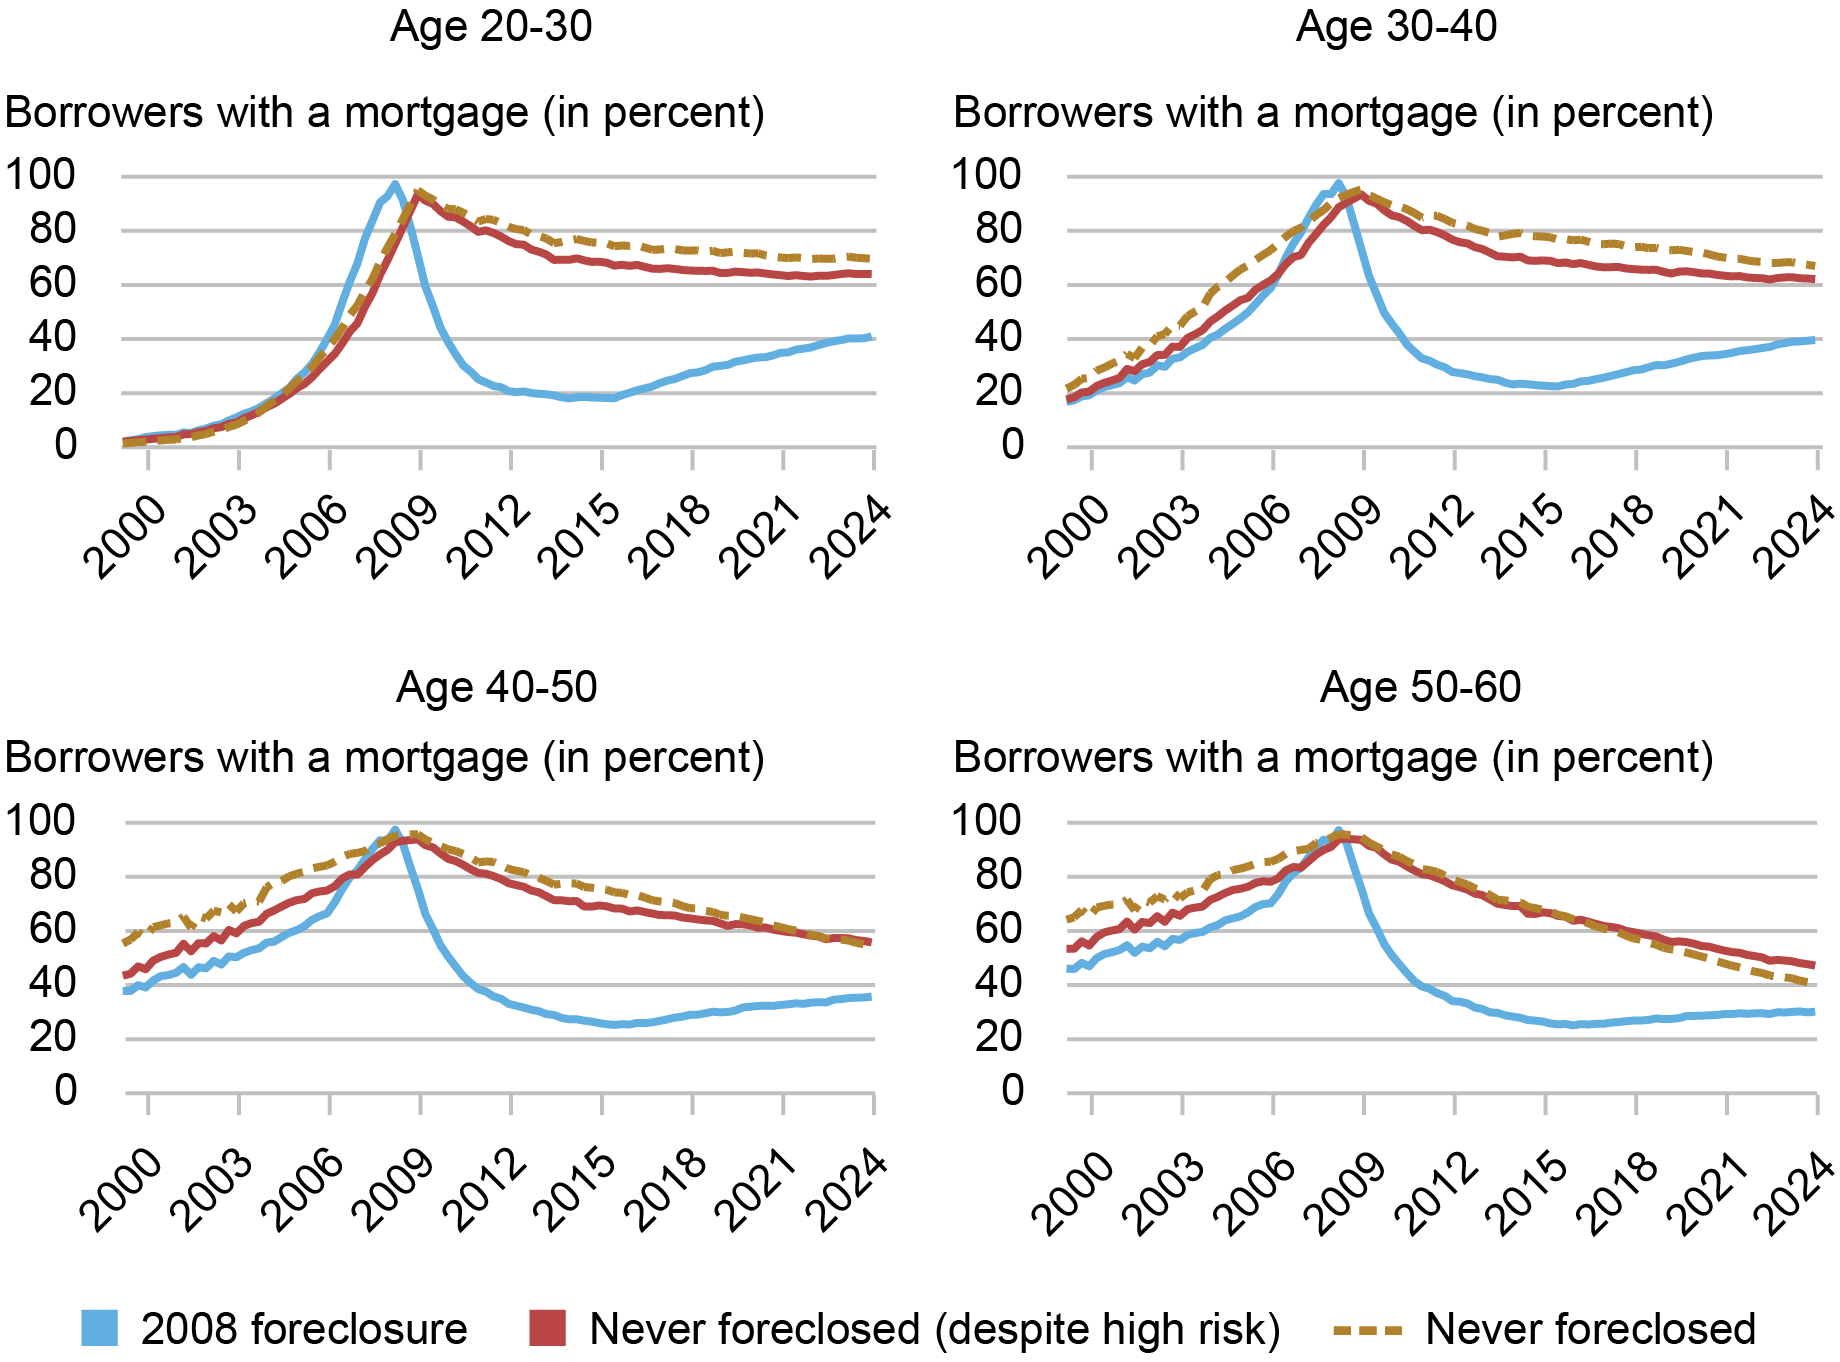
Note: Homeownership is defined as having a mortgage on the credit report.
Finally, we consider what types of other debts the borrowers have who foreclosed in 2008 have on their 2023 credit reports. Notably, not all individuals who had a foreclosure were mortgage borrowers; this is because they may have been listed as joint borrowers on the deed but not on the loan, or because the homeowner may have been foreclosed on for reasons other than mortgage nonpayment, such as a lien or tax judgment. We first see, consistent with our findings above, that those who foreclosed in 2008 are far less likely to have a mortgage or a home equity line of credit (HELOC) account compared to the non-foreclosing group. Credit card usage more generally is lower among those who foreclosed. Meanwhile, auto debt is more prevalent among those who foreclosed.
Credit Participation
| 2008 | 2023 | |||
|---|---|---|---|---|
| Foreclosure | No foreclosure | Foreclosure | No foreclosure | |
| Have a mortgage | 97.6% | 100.0% | 36.3% | 51.1% |
| Have a HELOC | 17.9% | 24.5% | 4.2% | 12.6% |
| Have an auto loan | 55.1% | 49.1% | 46.7% | 36.6% |
| Have a credit card | 80.9% | 91.9% | 73.7% | 80.7% |
| Median credit score | 505 | 767 | 696 | 802 |
Notes: The “no foreclosure” group includes individuals who never had a foreclosure but did have a mortgage on their credit file in 2008. HELOC is home equity line of credit. Credit score is Equifax Risk Score 3.0.
The foreclosure flags have long disappeared from the credit reports of the nearly 5 million Americans who experienced a foreclosure during the housing bust, yet the financial scarring has lingered on their financial experience in various ways—they have persistently lower credit scores and are less likely to own a home. These consequences are long-term, especially for new entrants to homeownership, resembling in some ways the long-term scarring effects on earnings and employment for young workers who first enter the labor market during recessions.
The economic interventions during the pandemic recession featured unprecedented supports to households and borrowers, reducing (and effectively eliminating) delinquency and preventing foreclosure during the most intense months of economic contraction in 2020. U.S. economic activity and employment rebounded more quickly in this recovery as many Americans were spared the long recovery from a foreclosure event, providing a sharp contrast to the deep marks left on the household sector following the Great Recession. Although the two crises differed in their underlying economic conditions, the prolonged path to recovery from the foreclosure crisis during the Great Recession versus the pandemic bounce-back could be a consideration for policymakers in addressing similar events in the future.

Andrew F. Haughwout is director of Household and Public Policy Research in the Federal Reserve Bank of New York’s Research and Statistics Group.

Donghoon Lee is an economic research advisor in Consumer Behavior Studies in the Federal Reserve Bank of New York’s Research and Statistics Group.

Daniel Mangrum is a research economist in Household and Public Policy Research in the Federal Reserve Bank of New York’s Research and Statistics Group.

Belicia Rodriguez is a senior research analyst in the Federal Reserve Bank of New York’s Communications and Outreach Group.

Joelle Scally is a regional economic advisor in the Federal Reserve Bank of New York’s Research and Statistics Group.

Wilbert van der Klaauw is an economic research advisor on Household and Public Policy Research in the Federal Reserve Bank of New York’s Research and Statistics Group.
How to cite this post:
Andrew Haughwout, Donghoon Lee, Daniel Mangrum, Belicia Rodriguez, Joelle Scally, and Wilbert van der Klaauw , “How Are They Now? A Checkup on Homeowners Who Experienced Foreclosure,” Federal Reserve Bank of New York Liberty Street Economics, May 8, 2024, https://libertystreeteconomics.newyorkfed.org/2024/05/how-are-they-now-a-checkup-on-homeowners-who-experienced-foreclosure/
BibTeX: View |


Disclaimer
The views expressed in this post are those of the author(s) and do not necessarily reflect the position of the Federal Reserve Bank of New York or the Federal Reserve System. Any errors or omissions are the responsibility of the author(s).
 RSS Feed
 Follow Liberty Street Economics
Thanks for your question. Generally, a foreclosure notation appears on a credit report when the bank initially begins foreclosure proceedings and then can remain on the report for up to seven years. We use the first appearance of that flag to date a foreclosure in this study.
Nice article. How are foreclosures defined by credit agencies? When referred for foreclosure proceedings or when foreclosure sale is completed.
Good article. I would be curious to see what interest rates and type of Loans (adjustable) affected the move to foreclosure. Also the significance of Loan to value ratios that made it economically sensible to walk away from the home.