


As the Great Financial Crisis and associated recession were unfolding in 2009, researchers at the New York Fed joined colleagues at the Board of Governors and Philadelphia Fed to create a new kind of data set. Household liabilities, particularly mortgages, had gone from being a quiet little corner of the financial system to the center of the worst financial crisis and sharpest recession in decades. The new data set was designed to provide fresh insights into this part of the economy, especially the behavior of mortgage borrowers. In the fifteen years since that effort came to fruition, the New York Fed Consumer Credit Panel (CCP) has provided many valuable insights into household behavior and its implications for the macro economy and financial stability.
The CCP was one of the first data sets drawn from credit bureau data, one of the earliest features of the Center for Microeconomic Data (CMD), and the primary source material for some of the CMD’s most important contributions to policy and research. Here we review a few of the main household debt themes over the past fifteen years, and how our analyses contributed to their understanding.
The New York Fed Consumer Credit Panel
The CCP is drawn from anonymized credit bureau data provided by Equifax and includes quarterly information on the liabilities of a dynamic panel of individuals (5 percent of the population with a credit report—approximately 14.2 million individuals in 2023:Q4) and their household members (an additional 11.5 percent/ 32.9 million individuals) beginning in the first quarter of 1999. The data are unique in many ways, but the dynamic panel structure was among the most important features since, in each quarter, the data provide a representative picture of credit outcomes of the U.S. population.
The data include all the major forms of household debt: mortgage and home equity lines of credit, credit cards, auto loans, and student loans. For each individual we observe the opening and closing of accounts, balances and credit limits on existing accounts, payment status on all forms of debt, and other features of the credit report, such as the individual’s credit score. In addition, we know the individual’s location (to the census block) and year of birth. More details on the data are available in Lee and van der Klaauw (2010).
The Great Financial Crisis and Recovery
The CCP immediately became an invaluable resource in understanding the extreme challenges that American households were facing even as the financial system and the economy began to recover. In one of the first analyses using the data, The Financial Crisis at the Kitchen Table, we documented the enormous run-up and subsequent decline in household debt and payment delinquencies between 2007 and 2009. In addition, we showed in numerous Liberty Street Economics posts that households had gone from borrowing heavily prior to the peak in home prices to defaulting and paying off debt at a rapid pace beginning in 2007.
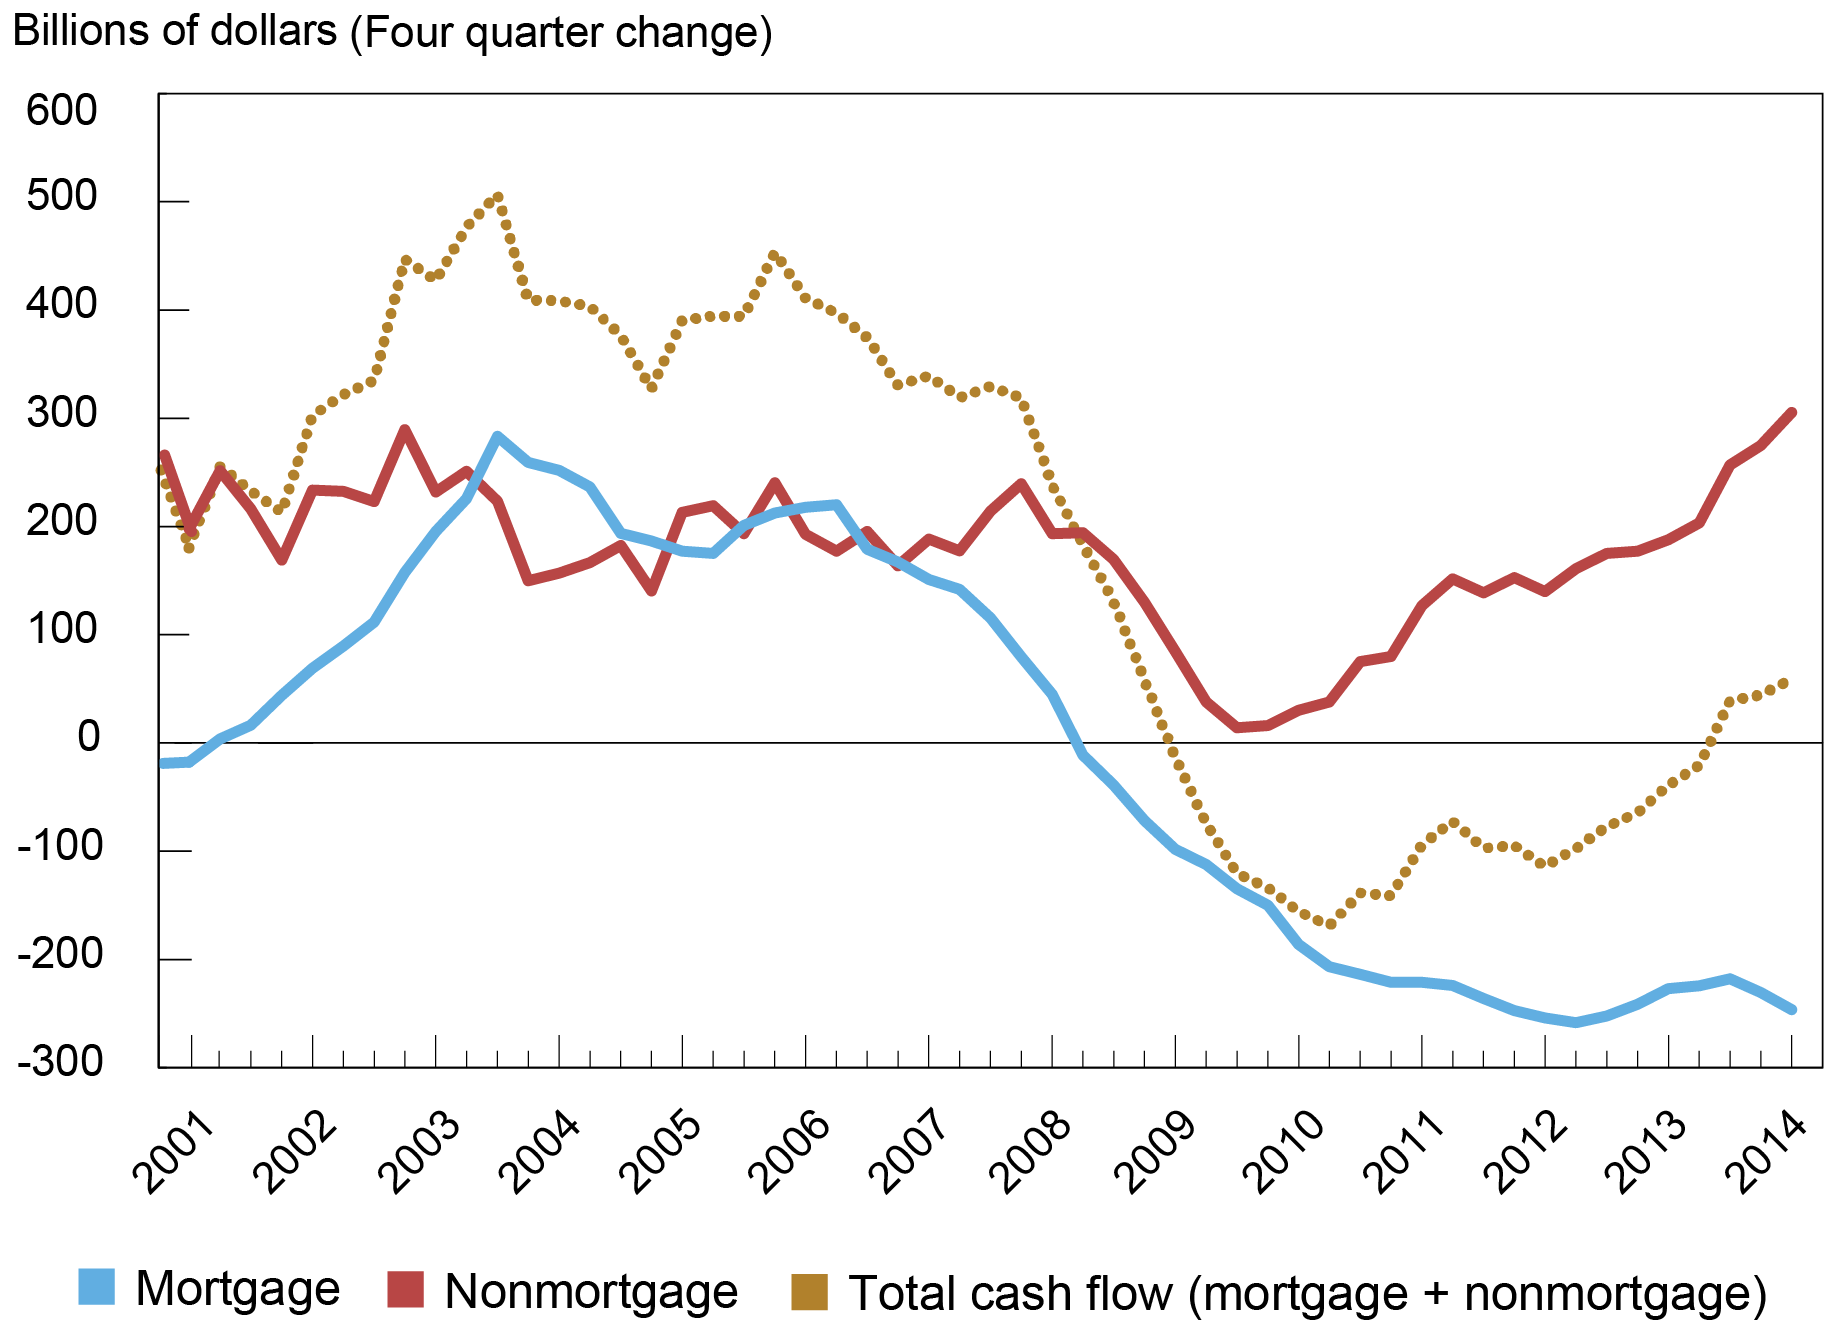
The deleveraging process finally concluded in 2013 (see the chart below), but not before millions of households had lost their homes through foreclosure or lost access to credit through bankruptcy. (Stay turned for our forthcoming post on the long-term consequences for those families.) The fact that the CCP presents a comprehensive picture of household balance sheets also enabled us to identify a then little-known dimension of the housing market boom and bust—the behavior of real estate speculators. Perhaps most importantly, the CCP now provides an early warning signal for stresses in the household sector—something that was not available before the GFC. It also reveals the households and neighborhoods where those stresses may occur.
Total Cash Flow from Household Debt Turned Slightly Positive in 2013
Student Debt
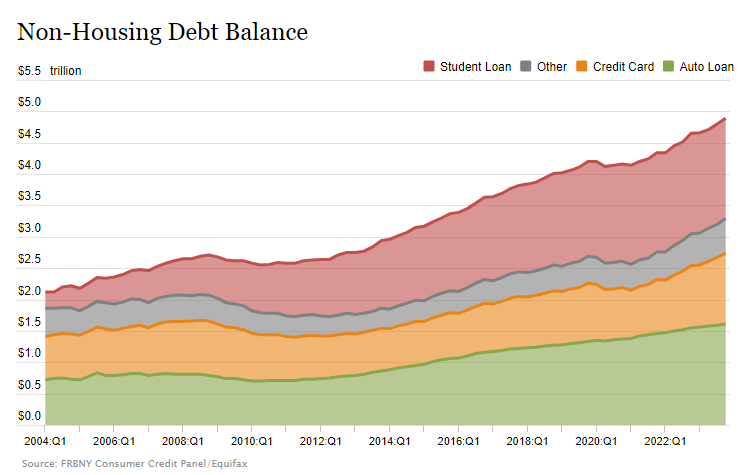
As the mortgage and housing markets began to return to a more stable footing after 2012, a new issue for household finance began to emerge: student debt. By 2012, student debt was the second largest household liability and the CCP provided insights into the rapid growth and performance of that stock of debt over the subsequent decade. These analyses were especially valuable because of the paucity of other information on student borrowing: While the federal government plays a dominant role in the market, only the CCP provided the kind of information needed to assess the role of student debt on household balance sheets and provided information about how student debt has become an increasingly important determinant of well-being.
By 2012 Student Debt Became the Second Largest Household Liability behind Mortgage Debt
Over time, the issues that our analyses pointed to became a central point of policy debate, and our work provided valuable evidence on the effects of various proposals.
Household Debt during the Pandemic and Beyond
Many of the concerns that had manifested themselves in the first decade of the CCP were very much in the forefront of economic policy discussions as the COVID-19 pandemic hit the U.S. in 2020. Seeking to avoid a wave of defaults and consumer distress, officials provided monetary and fiscal stimulus, placed moratoria on foreclosures, offered forbearance on many mortgages and student loans, and encouraged lenders to work with borrowers on their other obligations. To help provide greater clarity on how the pandemic and these policies were affecting households, we acquired monthly CCP updates that allowed high-frequency analyses, and these proved themselves invaluable in charting the patterns of hardship and the incidence of the policy benefits. In particular, widespread forbearances were unprecedented and the CCP enabled us to follow borrowers whose mortgages and student loan payments were paused.
As the forbearance programs largely wound down, we were able to take a look back at who benefited and a look ahead at what might come next for these borrowers. In the end, student loan forbearance lasted far longer than that for mortgages, and we were able to document important impacts of this policy. As policy discussion turned to the idea of permanent student loan forgiveness we were able to provide deep insights into who would benefit and how much in general and based on the specifics of the White House plan. We also were able to show that the unique combination of economic outcomes and policy interventions during COVID had a profound impact on household balance sheets and cash flows, including reductions in credit card debt and delinquency rates, that continues to affect the macroeconomy today.
A Large Impact on Research and a Bright Future
In addition to these major areas of enduring interest, the CCP has shown its value in many other ways. The current attention to rising credit card and auto loan delinquencies is a contemporary example and there will continue to be many more. In the meantime, CCP data have been used in hundreds of research studies, deepening understanding of how household liabilities affect welfare and the economy. The initial idea of the CCP was to give policymakers insight into household debt developments in order to avoid a repeat of the events of the Great Financial Crisis. But the scope of analysis using CCP data has also begun to extend beyond household debt to study trends, such as migration, small business finance, gentrification, and disaster resilience. We remain committed to using the data to help us understand the underpinnings and disparities in household finances and to allow us to monitor developments on a high-frequency basis.

Andrew F. Haughwout is director of Household and Public Policy Research in the Federal Reserve Bank of New York’s Research and Statistics Group.

Donghoon Lee is an economic research advisor in Consumer Behavior Studies in the Federal Reserve Bank of New York’s Research and Statistics Group.

Daniel Mangrum is a research economist in Household and Public Policy Research in the Federal Reserve Bank of New York’s Research and Statistics Group.

Joelle Scally is a regional economic advisor in the Federal Reserve Bank of New York’s Research and Statistics Group.

Wilbert van der Klaauw is an economic research advisor on Household and Public Policy Research in the Federal Reserve Bank of New York’s Research and Statistics Group.
How to cite this post:
Andrew Haughwout, Donghoon Lee, Daniel Mangrum, Joelle Scally, and Wilbert van der Klaauw , “The New York Fed Consumer Credit Panel: A Foundational CMD Data Set,” Federal Reserve Bank of New York Liberty Street Economics, April 17, 2024, https://libertystreeteconomics.newyorkfed.org/2024/04/the-new-york-fed-consumer-credit-panel-a-foundational-cmd-data-set/
BibTeX: View |

Disclaimer
The views expressed in this post are those of the author(s) and do not necessarily reflect the position of the Federal Reserve Bank of New York or the Federal Reserve System. Any errors or omissions are the responsibility of the author(s).
 RSS Feed
 Follow Liberty Street Economics