


It has been a little over ten years since we started releasing findings from the Federal Reserve Bank of New York’s Survey of Consumer Expectations (SCE). In this post, we review some of the headline findings from the first decade of the survey’s history, highlighting the evolution of consumers’ expectations about inflation and labor market outcomes.
A New Approach to Tracking Consumer Expectations
The SCE is a nationally representative, internet-based monthly survey of a rotating panel of about 1,300 household heads in the United States. The survey collects timely, high-frequency information about consumer expectations for a broad range of macroeconomic and personal economic outcomes.
The survey was the outcome of a six-year development project, the focus of which was to examine existing measures of inflation expectations and propose more quantitative alternative measures. In addition to inflation expectations, our objective was to capture consumers’ degree of uncertainty about future inflation and elicit their expectations about many other economic outcomes. This development and testing phase involved best-practice survey design approaches, including collaborations with renowned psychologists on cognitive interviews and follow-up surveys, and the pretesting of survey questions using randomized survey-based experiments. Another important design component of the SCE is its rotating panel structure—whereby each respondent stays in the panel for twelve months and a share of respondents rotate out of the panel each month, being replaced by new respondents. This design enables researchers to study how individual consumers revise their expectations over time.
Over the past decade, the SCE has expanded considerably in scope. Each month, the “core” questionnaire elicits expectations from a stable panel of consumers on a broad variety of macroeconomic and personal topics, covering outcomes such as inflation, unemployment, home price changes, credit availability, individual wage growth, the likelihood of losing or finding a job, household spending, and income growth. In 2014, we started reporting findings from two special survey modules, on housing and credit access, fielded at annual and triannual frequency, respectively. In 2017, we introduced the SCE labor market module, followed in 2019 by the household spending and public policy modules, all fielded at a triannual frequency with series generally dating back to 2014 or 2015. Over the past ten years, we have also asked a wide range of special questions on timely topics (related, for instance, to the Affordable Care Act, CARES Act stimulus payments, and the 2022 spike in gasoline prices) and conducted survey field experiments to improve our understanding of how individuals form and update expectations, and how these in turn affect their behavior.
A unique feature of our survey is the use of a probabilistic question format, which asks respondents to assess the “percent chance” of a given event happening. For outcomes that can take on a range of values (such as inflation or home prices), this involves asking respondents for their full subjective “density forecast”—that is, the probability they assign to, say, inflation falling into each of a pre-determined set of bins. We then measure uncertainty by the degree of dispersion in each individual’s density forecast. Our earlier work, in line with an extensive literature on the topic, has shown the feasibility and benefits of this format, yielding answers that capture beliefs in a way that is comparable across respondents. With respect to inflation expectations, another important aspect of the SCE is that it was designed to ask respondents their beliefs about the short (one year ahead) and medium (three years ahead) terms, with the latter measure capturing inflation expectations for the twelve-month period starting two years from today.
Over time, the different components of the survey have proven to be highly valuable for monitoring and analyzing a wide range of consumer beliefs and behavior. In this post, we highlight two areas of focus since the onset of the COVID-19 pandemic: expectations regarding inflation and wage growth.
Inflation Expectations
As shown in the chart below, for the first seven years of the SCE we saw little movement in inflation expectations and uncertainty at both the one- and three-year horizons. This all changed during the pandemic. The surge in actual inflation that started in spring 2021 was accompanied by a sharp rise in inflation expectations at the one-year horizon and, to a lesser extent, at the three-year horizon. This divergence between short- and medium-term inflation expectations sparked interest in the movements of longer-term expectations. For this reason, in January 2022 we began asking about inflation expectations at the five-year horizon as well.
Median one-year-ahead inflation expectations reached a high of 6.8 percent in June 2022 and have since been trending downward, while median three-year-ahead inflation expectations showed a more muted increase, peaking at 4.2 percent in October 2021. The fact that three-year-ahead inflation expectations peaked lower and started to drop well before one-year-ahead inflation expectations was a clear indication that consumers anticipated that most of the rise in inflation would not persist. This finding was also reflected in the relative stability of median five-year-ahead inflation expectations and was consistent with experimental evidence collected at various points during 2021 indicating that longer-term inflation expectations remained well anchored during this period, as measured by their sensitivity to shocks in current inflation levels.
While median inflation expectations are now essentially back to their pre-pandemic ranges, inflation uncertainty, which similarly displayed a substantial increase during 2020-21, has been slower to fall back to pre-COVID levels at all three horizons and remains somewhat elevated, with consumers continuing to assign a higher average likelihood to both deflation and to inflation above 4 percent.
2021 Surge in Inflation Sparks Rise in Short-Term Inflation Expectations
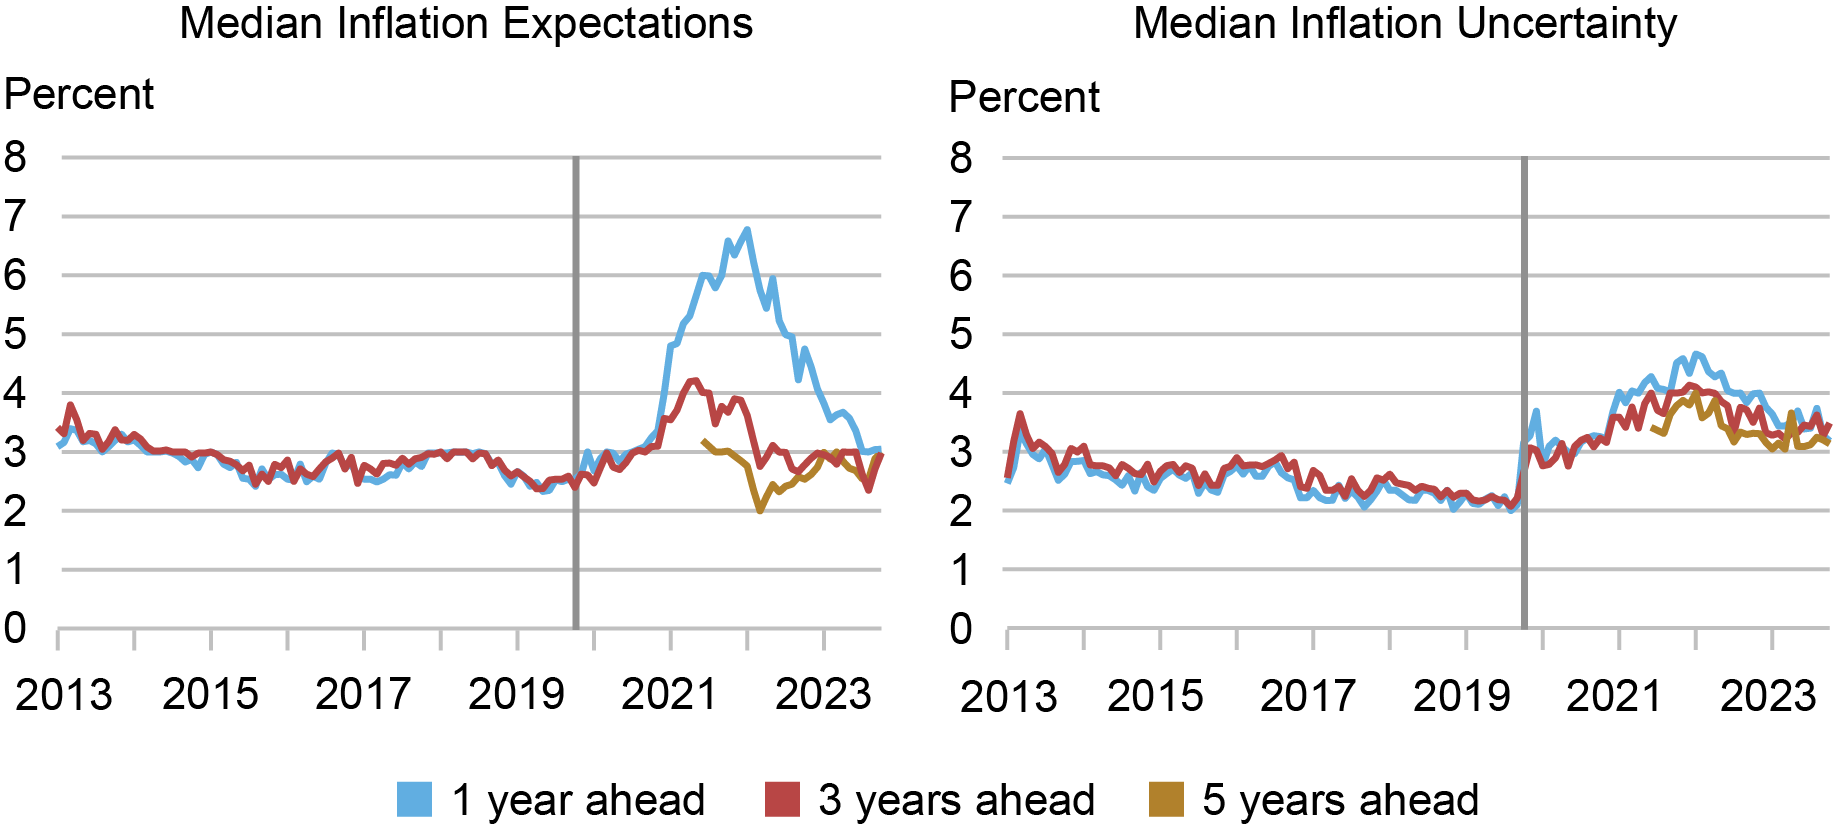
Source: New York Fed Survey of Consumer Expectations.
Notes: The vertical line denotes the start of the pandemic. Data start in June 2013; tick marks fall on June for each year.
Labor Market Expectations
Another component of our core monthly survey is the elicitation of labor market expectations, including expectations about on-the-job earnings growth and the perceived risks of layoff and quitting. Like inflation expectations, earnings growth expectations should affect consumers’ inter-temporal decisions (consuming now versus consuming later, for instance) and are therefore of great value for understanding and forecasting economic behavior.
As shown in the lefthand panel of the chart below, median year-ahead earnings growth expectations were relatively stable at about 2.5 percent until the onset of the pandemic in the spring of 2020, when we saw a temporary drop, followed by a rise to about 3.0 percent by early 2022. When distinguishing respondents by their level of earnings, we observed a higher level and bigger increase in the median expected wage growth for respondents with above-median ($48,000) annual earnings. This contrasts with what actually happened, as earnings growth among workers with below-median annual earnings turned out to be larger between early 2021 and mid-2022. Since mid-2022, median expected earnings growth has been relatively stable at 3.0 percent, with a slight decline to 2.8 percent by the end of 2023. Also shown in the panel are the 25th and 75th percentiles of the distribution of earnings growth expectations across respondents. While the former has remained constant through the entire ten-year period at 1 percent, the latter shows largely parallel movements to those for the median.
The righthand panel in the chart below shows a contrasting pattern for earnings growth uncertainty, which has remained relatively stable over the past ten years, only showing a gradual and persistent increase following the start of the pandemic. Today, wage growth uncertainty remains somewhat above pre-COVID levels. Our analysis shows that this is driven primarily by respondents who are below age 40 and those with an annual household income of less than $50,000.
After an Initial Fall, Earnings Growth Expectations Rise during the Pandemic
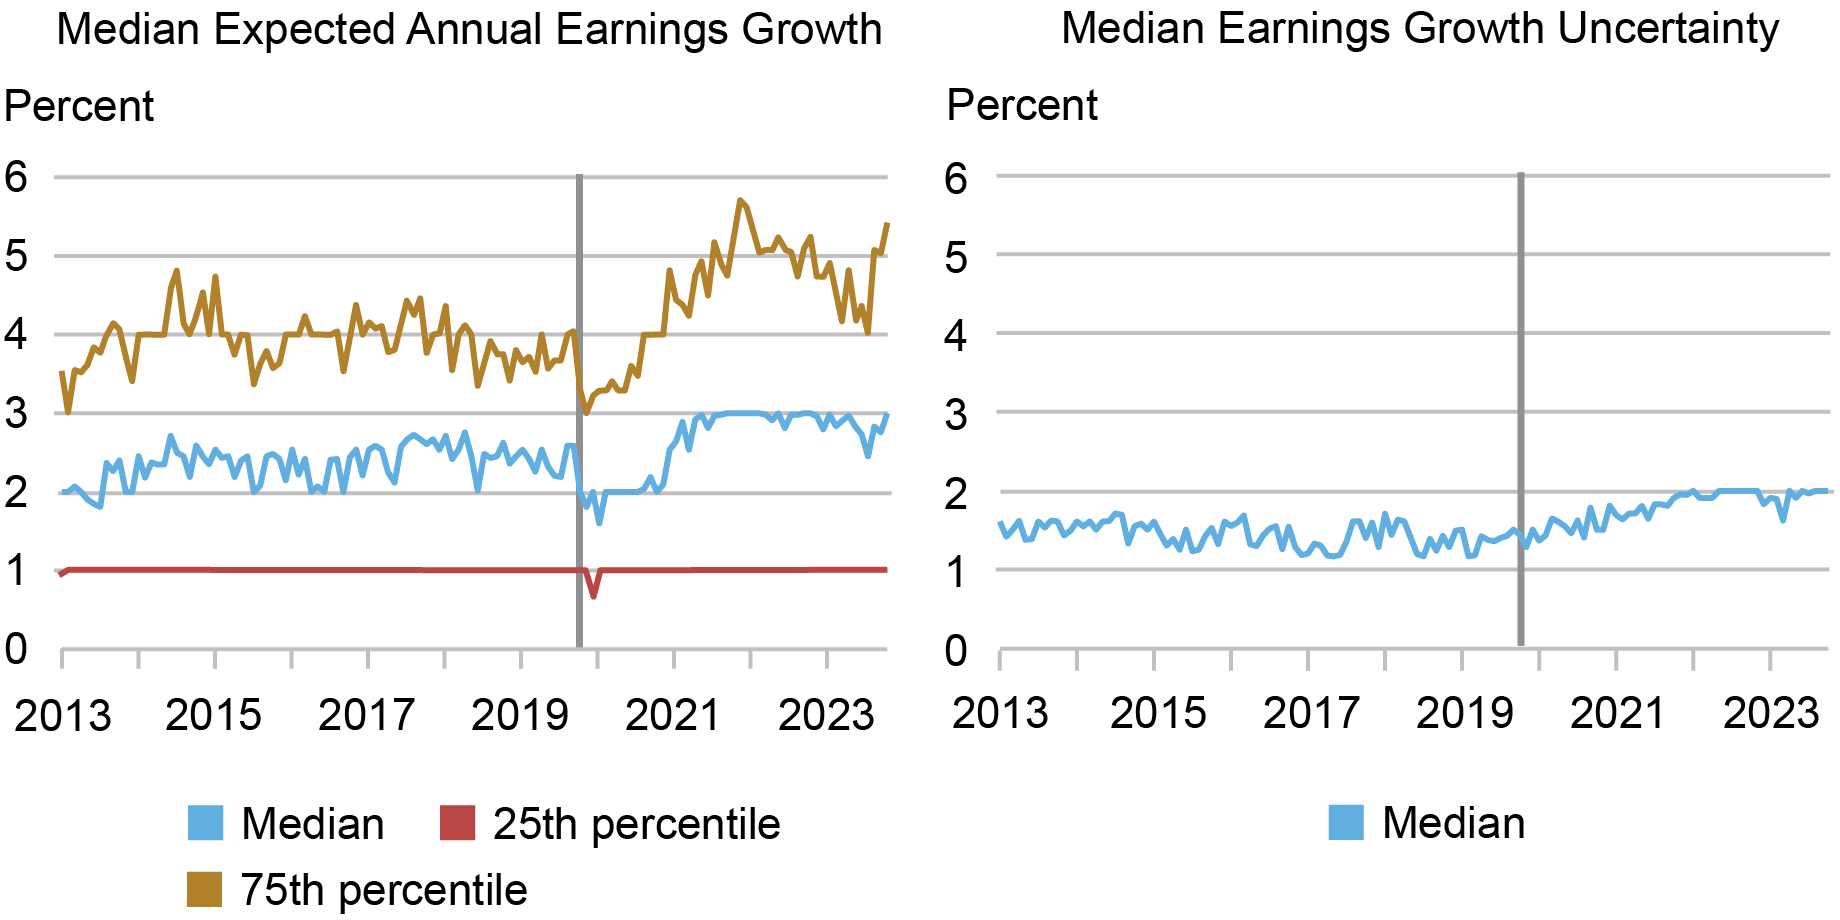
Source: New York Fed Survey of Consumer Expectations.
Notes: The vertical line denotes the start of the pandemic. Data start in June 2013; tick marks fall on June for each year.
Finally, we examine trends in layoff and quit expectations, measured as the average percent chance a respondent assigns to the possibility of being laid off and to the possibility of quitting her or his job voluntarily. Average year-ahead layoff probabilities, shown in the chart below, declined somewhat during the mid-2010s, after which they stabilized in the 13.5-14.5 percent range. As the pandemic hit, average job loss probabilities initially surged to 21 percent, but then fell steadily to levels well below those that prevailed before the pandemic, reaching 10.4 percent in April 2022 and 13.4 percent in December 2023. Average quit probabilities instead dropped sharply at the onset of the recession, then rebounded to levels just below those that prevailed pre-pandemic. A comparison to the timing and magnitude of the jump in actual layoffs spotlights the unexpected nature of the pandemic-induced recession, showing that the surge in layoffs at the beginning of the pandemic was clearly unanticipated. Of similar interest is the relatively modest increase during the 2021-22 period in quit expectations, compared to the much larger “great resignation” wave recorded in the Job Openings and Labor Turnover Survey by the Bureau of Labor Statistics. This suggests that many quits during this period appear to have been unplanned and spontaneous.
Layoff Expectations Jump with the Onset of the Pandemic, then Steadily Decline
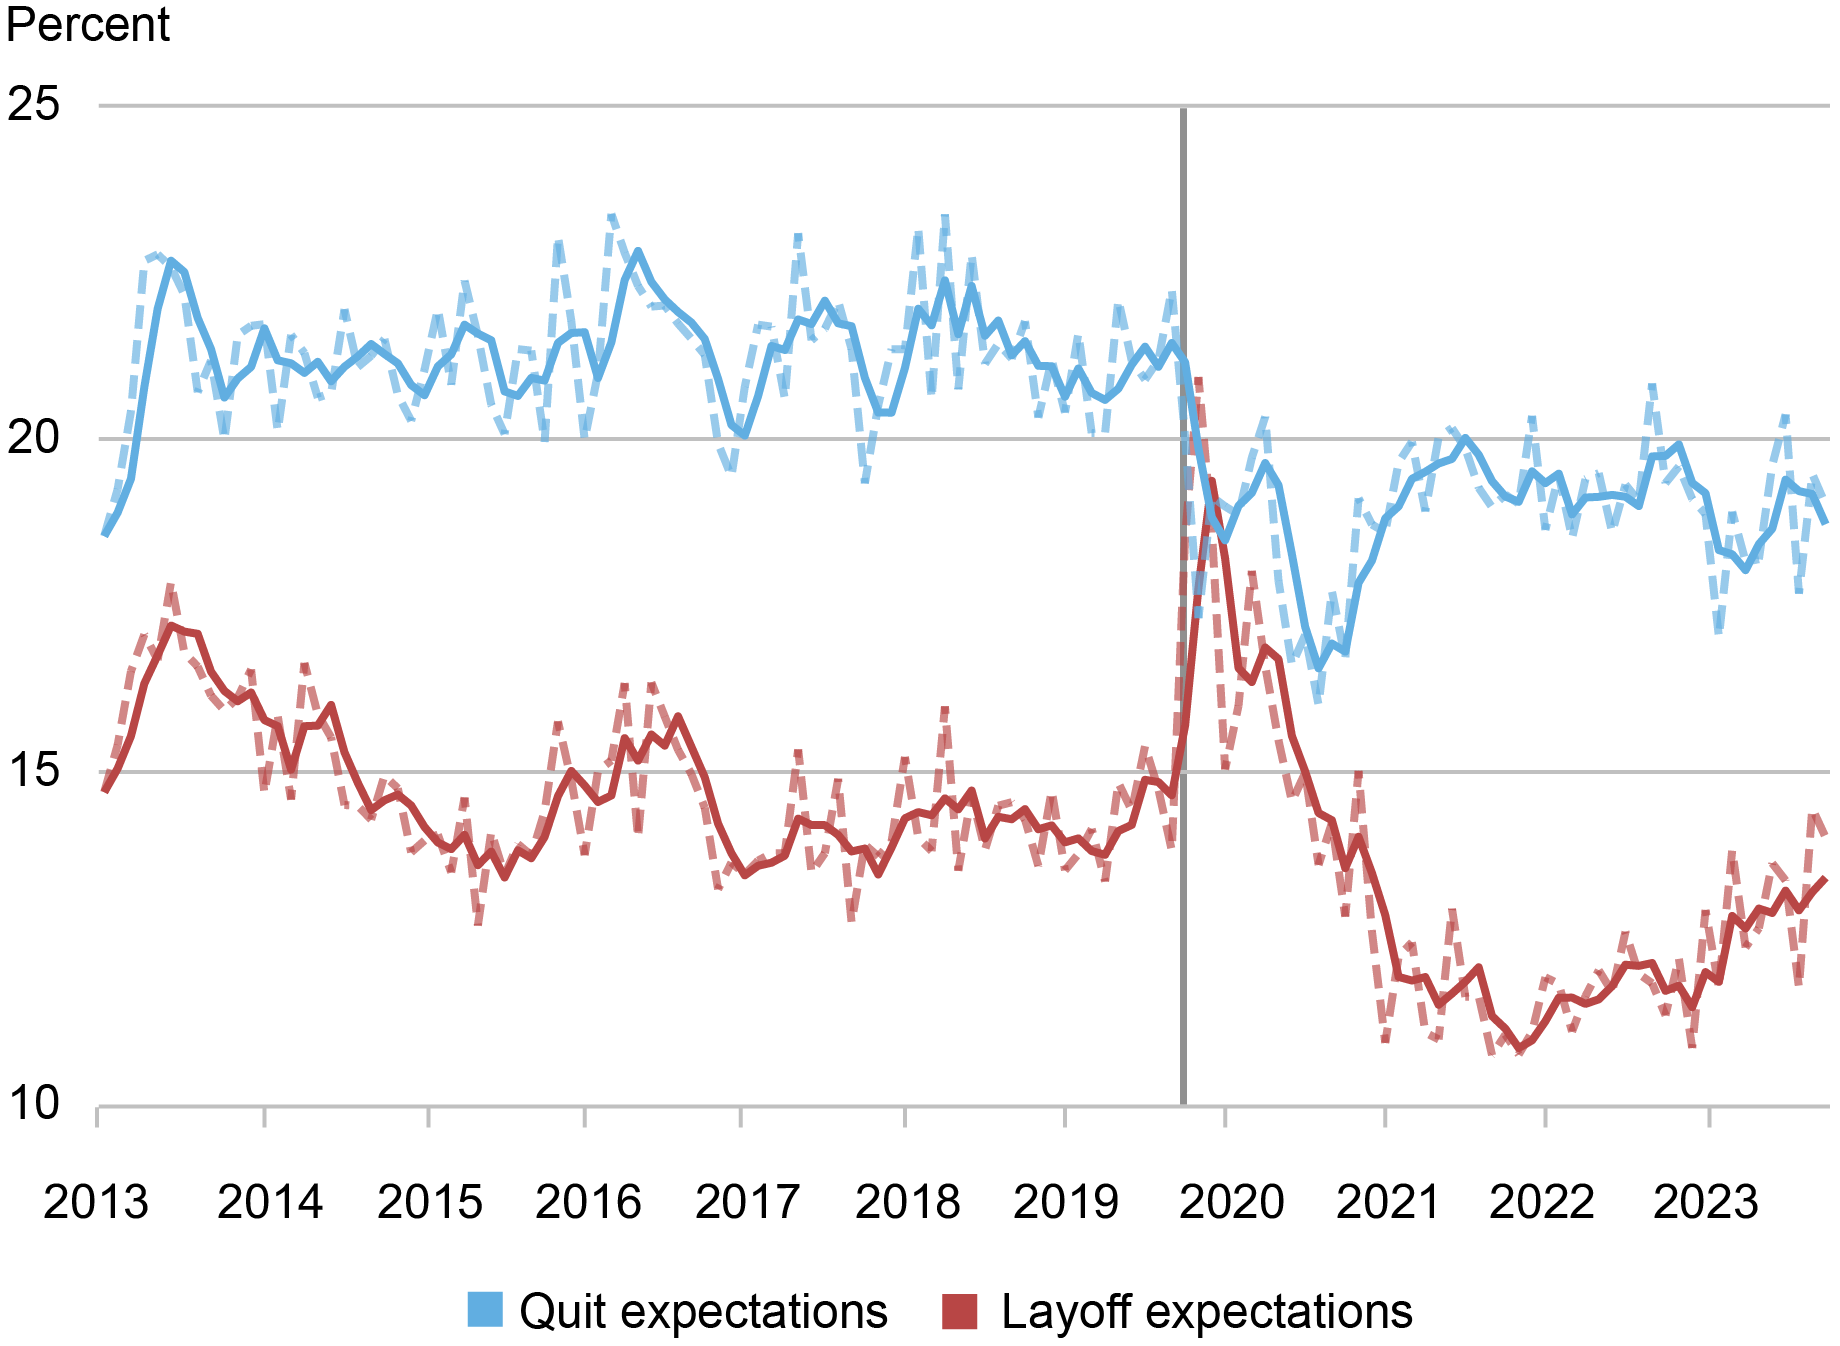
Source: New York Fed Survey of Consumer Expectations.
Notes: The vertical line denotes the start of the pandemic. The solid red and blue lines show the three-month moving averages of the two series. Data start in June 2013; tick marks fall on June for each year.
Summing Up
In this post, we analyzed the dynamics of inflation and labor market expectations to illustrate the breadth and depth of information collected in the SCE. Over the past decade, SCE data have yielded insights on a host of other topics, including changes in experiences and expectations regarding credit access, how people find jobs, why workers search for new jobs, expected and actual impacts of stimulus checks on spending, saving and debt paydown during the pandemic, how people view housing as an investment, polarization of beliefs around elections, use of buy-now-pay-later loans, and borrower expectations for the return of student loan repayment. An important aspect of the SCE is that we make our data accessible for free. In addition to informing the public, the media, and policymakers, these data releases have also been cited in more than 170 academic research papers that develop novel insights on a variety of topics. We are looking forward to the next decade of monthly SCE updates and path-breaking analyses.

Olivier Armantier is the head of Consumer Behavior Studies in the Federal Reserve Bank of New York’s Research and Statistics Group.

Gizem Kosar is a research economist in Consumer Behavior Studies in the Federal Reserve Bank of New York’s Research and Statistics Group.

Giorgio Topa is an economic research advisor in Labor and Product Market Studies in the Federal Reserve Bank of New York’s Research and Statistics Group.

Wilbert van der Klaauw is an economic research advisor on Household and Public Policy Research in the Federal Reserve Bank of New York’s Research and Statistics Group.
How to cite this post:
Olivier Armantier, Gizem Koşar, Giorgio Topa, and Wilbert van der Klaauw, “The Survey of Consumer Expectations: A Look Back at the Past Decade,” Federal Reserve Bank of New York Liberty Street Economics, April 16, 2024, https://libertystreeteconomics.newyorkfed.org/2024/04/the-survey-of-consumer-expectations-a-look-back-at-the-past-decade/
BibTeX: View |


Disclaimer
The views expressed in this post are those of the author(s) and do not necessarily reflect the position of the Federal Reserve Bank of New York or the Federal Reserve System. Any errors or omissions are the responsibility of the author(s).
 RSS Feed
 Follow Liberty Street Economics