


Global factors, like monetary policy rates from advanced economies and risk conditions, drive fluctuations in volumes of international capital flows and put pressure on exchange rates. The components of international capital flows that are described as global liquidity—consisting of cross-border bank lending and financing of issuance of international debt securities—have sensitivities to risk conditions that have evolved considerably over time. This risk sensitivity has been driven, in part, by the composition and business models of the financial institutions involved in funding. In this post, we ask whether these same features have led to changes in the pressures on currency values as risk conditions evolve. Using the Goldberg and Krogstrup (2023) Exchange Market Pressure (EMP) country indices, we show that the features of financial institutions in the source countries for international capital do influence how destination countries experience currency pressures when risk conditions change. Better shock-absorbing capacity in financial institutions moderates the pressures toward depreciation of currencies during adverse global risk events.
International Capital Flow Pressures and Risk Sensitivity
The traditional way to measure the results of international capital flow pressures is to track the behavior of country exchange rates defined as units of domestic currency needed to purchase a unit of foreign currency. This traditional exchange rate measure masks the part of the pressures that foreign governments work to temper by applying tools like foreign exchange intervention and monetary policy rate changes. To correct this shortcoming, the Goldberg and Krogstrup EMP model represents these interventions in exchange rate depreciation equivalent units and then provides a consolidated alternative to the actual exchange rate change that can be compared across countries and over time. By country, this measure captures a mix of currency depreciation, foreign exchange intervention, and monetary policy changes.
The related Global Risk Response index (GRR) estimates the correlation between monthly values of the EMP and variations in a measure of risk that, typically, is the VIX index of the implied volatility in S&P 500 stock index option prices from the Chicago Board Options Exchange (CBOE). Positive values indicate a tendency toward currency appreciation pressures when risk conditions worsen, while negative values imply currency depreciation pressures. Research shows that worsening risk leads to appreciation pressures on relatively stable safe-haven currencies, such as the U.S. dollar, the Swiss Franc, and the Japanese Yen, and depreciation pressures on other currencies.
During the period following the global financial crisis (GFC), the risk sensitivity of global liquidity declined significantly, as discussed in this recent Liberty Street Economics post. Have evolving foreign financial institution conditions shaped how a domestic currency is pressured in response to changing risk conditions, similar to the case for global liquidity flows?
Unpacking EMP Risk Sensitivity Drivers
We use regression analysis to estimate the relationship between the EMP (defined in depreciation units of the local currency versus the U.S. dollar), and the VIX, U.S. monetary policy, and several global and borrowing country-level controls. We use the term Other Advanced Economies (OAEs) to refer to advanced economies other than those that are characterized as so-called safe havens. Regressions use data for a sample of thirty-eight “countries” that includes eight OAEs, three safe havens, and twenty-seven emerging market economies (EMEs) over the period 2000:Q1-2024:Q4. The Euro Area is considered as a single advanced economy due to its shared currency.
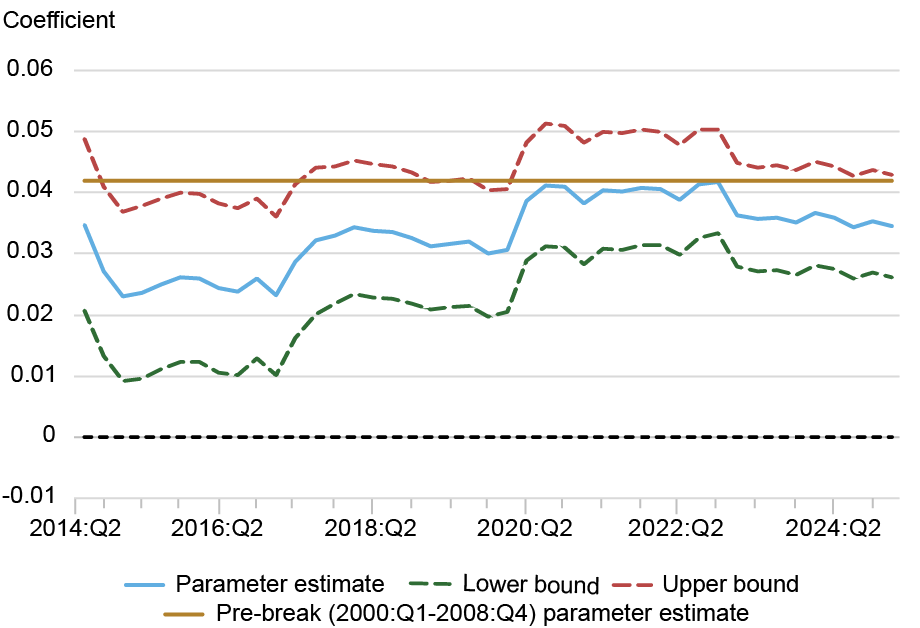
The risk sensitivity of the EMP varies over time for OAEs and EMEs. The panel chart below shows the post-GFC period, with a pre-break sensitivity line. Pre-GFC, OAE EMPs had a risk sensitivity of about 4.6 percentage points. Then, the risk sensitivity declines in the post-GFC period, remaining below pre-GFC levels through the end of 2024. The pattern is similar for EMEs, although notably the pre-break sensitivity for EMEs is higher at 4.2 percentage points under the EMP measure than the exchange rate at 3.3 percentage points. (Exchange rate depreciation figures are not shown but can be provided upon request.) During the period immediately following the GFC, we see a spike in risk sensitivities across both OAEs and EMEs. The EMP’s risk sensitivity jumps from 4.2 to 12.3 percentage points through 2013, reflecting increased risk sensitivity globally in response to the crisis. In the following period, risk sensitivity drops to below pre-GFC level across both economy types, possibly due to tighter regulation ameliorating capital flow pressures in response to risk. For EMEs, the response to elevated risk is captured more strongly by the EMP compared to what would be measured if the exchange rate alone was considered, with the risk sensitivity 3.5 percentage points for the former versus 3.1 percentage points for the latter. For OAEs, the EMP and the exchange rate perform similarly, with a full period post-GFC sensitivity of 2.7 percentage points under the EMP.
Risk Sensitivities Remain Below Pre-Crisis Levels
EMP (USD): OAE

EMP (USD): EME
Source: Authors’ calculations.
Notes: The panel chart shows the evolution over time of sensitivities to the log (VIX) for currency Exchange Market Pressure (EMP) from 2014:Q2-2024:Q4. For each quarter t, the illustrations show the post-break coefficient (and its 90% confidence interval) obtained by estimating the model with a sample from 2000:Q1 up to quarter t, with a break in 2009:Q1. The gold line in each panel represents the pre-break estimate of the sensitivity to VIX. The Other Advanced Economies (OAEs) are Australia, Canada, Denmark, Euro Area, Great Britain, Norway, New Zealand, and Sweden. The Emerging Market Economies (EMEs) are Armenia, Bolivia, Brazil, Botswana, Chile, China, Colombia, Czech Republic, Hong Kong, Hungary, Israel, India, Jordan, South Korea, South Africa, Morocco, Mexico, Malaysia, Peru, Poland, Romania, Russia, Singapore, Thailand, Tunisia, Ukraine, and Uruguay. (Three “safe-havens” —Japan, Switzerland, and United States—are part of the full data sample, but are not included here).
What is the role played by source country financial institution conditions? Focusing on OAEs, we find that higher bank capitalization dampens the risk sensitivity of exchange market pressure, as does lower leverage of nonbank financial institutions (NBFI). Specifications that include measures of financial institution health suggest that for OAEs an increase in bank capitalization decreases the EMP sensitivity to risk by 1.5 percentage points, which is equivalent to an increase in bank capitalization levels from 5.3 to 6.2. This result is consistent with our hypothesis that better capitalized banks experience less currency pressure in response to risk. We also find that an increase in NBFI leverage increases the EMP sensitivity to risk by 1.9 percentage points, suggesting that more leveraged NBFI lenders elevate currency pressure on the borrowing country.
Are Changes in Risk Sensitivity Permanent or Transitory?
While higher banking sector capitalization in the source countries of lending flows lowered risk sensitivity of exchange market pressures, other drivers of change could also be important. For example, we have not taken into account the characteristics of the domestic financial institutions involved in sourcing or receiving international capital flows. Nor have we considered the role of micro and macroprudential instruments that have been introduced to respond to cyclical and structural vulnerabilities within countries.

Linda S. Goldberg is a financial research advisor in the Federal Reserve Bank of New York’s Research and Statistics Group.

Samantha Hirschhorn is a research analyst in the Federal Reserve Bank of New York’s Research and Statistics Group.
How to cite this post:
Linda S. Goldberg and Samantha Hirschhorn, “Financial Intermediaries and Pressures on International Capital Flows,” Federal Reserve Bank of New York Liberty Street Economics, September 22, 2025, https://doi.org/10.59576/lse.20250922
BibTeX: View |


Disclaimer
The views expressed in this post are those of the author(s) and do not necessarily reflect the position of the Federal Reserve Bank of New York or the Federal Reserve System. Any errors or omissions are the responsibility of the author(s).
 RSS Feed
 Follow Liberty Street Economics