


U.S. trade policy remains in flux. Nevertheless, important elements of the new policy regime are apparent in data through July. What stands out are the large differences in realized tariff rates by trading partner, ranging from less than 5 percent for Canada and Mexico to 15 percent for Japan and to 40 percent for China. This post shows that the bulk of cross-country differences in tariff rates is explained by two factors: the U.S.-Canada-Mexico free trade agreement and differing sales shares in tariff-exempt categories.
Rising Tariff Rates, Rising Tariff Revenues
U.S. tariff rates have risen dramatically since the start of the year. The policy shift began in February with new tariffs on goods from China. The shift continued with additional measures aimed at China; new tariffs on products from Canada and Mexico; targeted tariffs on steel and aluminum products and on the auto sector; and the April announcement of higher tariffs on a broad range of countries. In July, the Administration announced tentative trade deals with several major trading partners (notably, the European Union (EU), Japan, and Korea) fixing baseline tariff rates at 15 percent, alongside stepped-up, country-specific “reciprocal” tariffs where no agreement had yet been reached. In late September, the Administration announced plans for new tariffs on certain pharmaceuticals, heavy trucks, and household furnishings. This account, of course, represents only the briefest of summaries, and developments are ongoing.
As shown in the chart below, U.S. tariff revenues have risen dramatically. The blue line shows net customs duties paid by importers and deposited in the U.S. Treasury. In 2024, net revenues for the year totaled $79 billion, an average of $6.6 billion per month. In August, revenues reached $30 billion—$360 billion on an annualized basis.
Government Revenues from Tariffs Have Skyrocketed
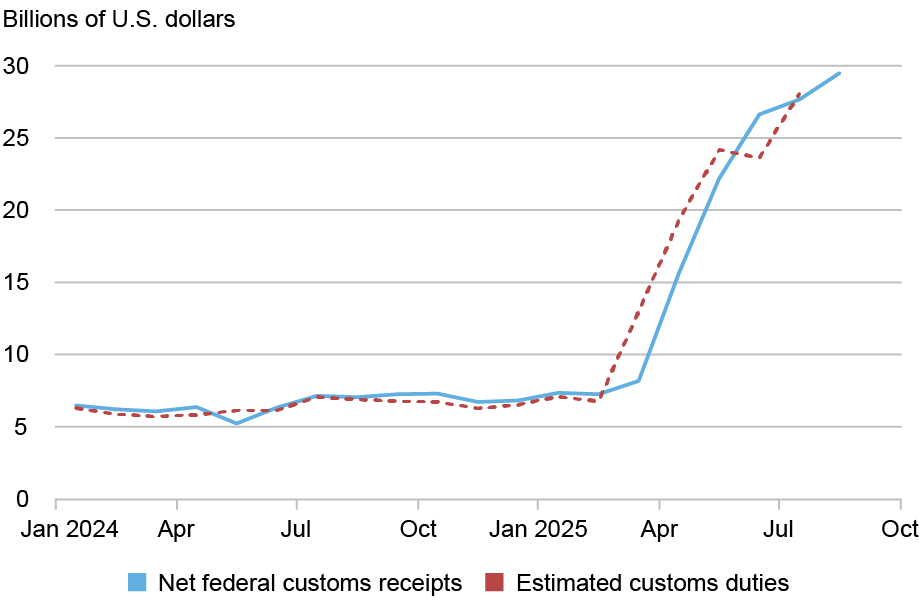
The aggregate realized tariff rate—revenues as a percentage of import values — reached roughly 10 percent in June and July and climbed to just under 11½ percent in August. Based on daily Treasury revenue reports, the rate in September is likely to come in close to the August figure. For comparison, the average tariff rate was 2.4 percent in 2024.
Dutiable Value and Realized Tariff Rates
To examine tariff details by country and product, we rely on data published by the U.S. Census Bureau. Unlike the Treasury series, the Census data are for calculated duties, estimated when goods come into port rather than when tariff revenues are received (sometimes several weeks later). Other measurement differences are outlined in Census documentation. We plot this series as the red line in the above chart. As can be seen from comparing the red and blue lines, the two series track closely over time. The Census Bureau also reports on dutiable value by country and product—imports subject to a duty versus those coming in duty free.
The table below summarizes the situation in July, focusing on the eight trading partners with the highest U.S. market share. (These data have yet to be released for August.) Collectively, these partners account for just over 80 percent of U.S. imports; two—the EU and ASEAN (the Association of Southeast Asian Nations)—are of course multicountry aggregates. The first column shows realized tariff rates, that is, the duties assessed divided by total imports. The second column shows the fraction of U.S. imports subject to duty. The third column shows realized tariff rates on goods subject to duty, calculated as duties assessed divided by dutiable imports rather than total imports.
The Share of Imports Subject to Duties Is the Key Driver of Realized Tariff Rates
| Import Partner | Realized Tariff Rates (Calculated as Share of Total Imports) | Share of Imports Subject to Duties | Realized Dutiable Tariff Rates (Calculated as Share of Dutiable Imports) |
|---|---|---|---|
| All countries | 9.7 | 46.4 | 21.0 |
| China | 40.4 | 93.9 | 43.0 |
| Japan | 14.8 | 84.9 | 17.4 |
| Korea | 13.1 | 69.7 | 18.7 |
| European Union | 9.1 | 61.7 | 14.7 |
| ASEAN | 8.4 | 54.5 | 15.5 |
| Mexico | 4.7 | 18.9 | 25.1 |
| Taiwan | 3.1 | 19.1 | 16.4 |
| Canada | 3.0 | 10.4 | 28.9 |
Notes: Data are for July 2025. The denominator for these calculations is imports for consumption. There can be a small gap between this variable and general imports given net movements into and out of bonded warehouses and free-trade zones. The Association of Southeast Asian Nations (ASEAN) is a regional grouping of ten states in Southeast Asia: Brunei, Cambodia, Indonesia, Laos, Malaysia, Myanmar, Philippines, Singapore, Thailand, and Vietnam.
The differences in realized tariff rates are quite dramatic. At one extreme, assessed duties on imported goods from China came to 40 percent of product value. Goods from Japan and Korea also faced high if less eye-popping duties, at 15 percent and 13 percent, respectively. At the lower extreme, duties on goods from Canada, Mexico, and Taiwan came in below 5 percent.
In the second column, we see that variation in the dutiable fraction of imports is also quite wide. Again, China stands at the top, with more than 90 percent of imports subject to duty. Japan is close behind, and Korea and the EU not that much farther behind. Canada, Mexico, and Taiwan show the lowest shares of imports subject to duty.
Given this pattern, it is no surprise that tariffs rates as a fraction of dutiable imports rather than total imports are more tightly bunched (column 3). China remains on top, at 43 percent. But realized tariff rates on goods from Canada and Mexico calculated on this basis are not too far behind, at 25 and 29 percent, respectively. Elsewhere, these realized rates approach or exceed 15 percent.
This leaves an obvious question: Why do dutiable import shares vary so widely across U.S. trading partners?
The Role of the U.S.-Canada-Mexico Agreement
An important reason for the low tariffs collected on goods from Canada and Mexico is the United States, Mexico, and Canada Agreement (USMCA), which took effect in 2020 as successor to the 1994 NAFTA treaty.
Under the terms of the USMCA, trade among the three countries is duty free so long as the preponderance of product value is generated in the region. (The required share is 60 to 75 percent depending on the product, though this is a considerable simplification: Trade agreements are complicated.) Firms are required to certify that goods entering the U.S. comply with treaty requirements. U.S. Customs can charge arrears and penalties for violations.
Executive orders have exempted USMCA-compliant goods from baseline and most product-based tariffs, such as those on autos and auto parts. Steel and aluminum products, however, have not been exempted and currently face a tariff rate of 50 percent.
The Census data contain detailed codes specifying whether goods came in under specific trade agreements. In July, some 79 percent of imports from Canada came in duty free under the USMCA, the bulk of the country’s total duty-free share (90 percent). Some 76 percent of imports from Mexico came in on this basis, also most of that country’s duty-free share (81 percent).
The July figures represent a sharp increase from 2024 when only 38 percent of imports from Canada and 50 percent of imports from Mexico were classified as USMCA-compliant. The reason for the increase is straightforward. Prior to this year, many goods came in duty free under general Most Favored Nation provisions or were subject to minimal tariff rates. Firms simply didn’t bother to file the USMCA paperwork. At July levels, official USMCA compliance is not far below analysts’ estimates of the share that meets the treaty’s regional content requirements.
The Role of Product Exemptions
Executive orders contain provisions exempting various products from baseline tariff increases. Examples include petroleum, many industrial raw materials, most pharmaceuticals, various categories of industrial machinery, and semiconductors and chip-making equipment. Importantly, goods from China are excluded from most of these product-based tariff exemptions.
In addition, several import categories remain exempt under longstanding provisions. Examples include items returned without processing, goods for the handicapped, gold, works of art, and certain low-value transactions.
The chart below summarizes the role of product-based exemptions. Some 38 percent of U.S. imports came in July came in duty free via product exemptions, more than two-thirds of the duty-free total. (Duty-free shares are simply 100 minus the dutiable value shares from our table.) For countries outside Canada and Mexico, product-based exemptions accounted for nearly all duty-free imports. Comparison of realized tariff rates for several thousand detailed Harmonized Tariff Schedule (HS8) product categories points to essentially uniform application of these exemptions across non-Chinese trading partners.
Product Exemptions Account for Most Duty-Free Imports Outside of the USMCA
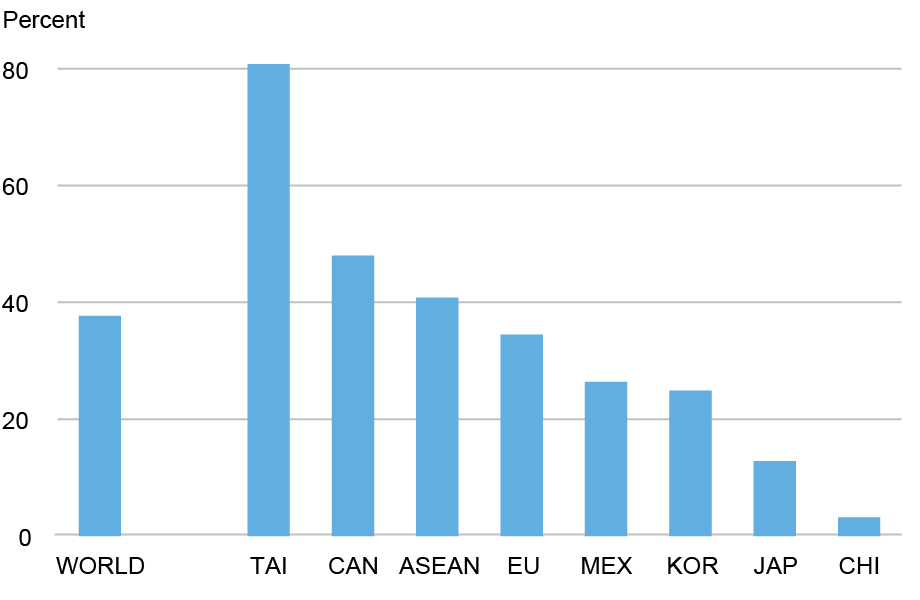
Notes: The chart plots the share of imports with product-based exemptions. Data are for July 2025. Exempt product codes are listed in Executive Order 14257, Annex II. A handful of additional exempt categories are identified based on detailed Census tariff rate codes. Figures for Canada and Mexico include goods also exempt from duty given USMCA compliance. The ASEAN countries are Brunei, Cambodia, Indonesia, Laos, Malaysia, Myanmar, Philippines, Singapore, Thailand, and Vietnam.
The variation in these exemptions is explained by patterns of specialization. Taiwan’s very high share reflects concentration specialized electronic components. Indeed, more than 70 percent of July sales were classified under just four exempt HS8 product codes out of several thousand. Conversely, Japan’s low share reflects the country’s minimal presence in most exempt categories, from raw materials and pharmaceuticals to electronic components. China’s very low share is of course due mainly to its exclusion from product exemptions rather than unfavorable specialization.
Some readers may have noticed an anomaly for Canada and Mexico: Taken together, product-based exemptions and USMCA compliance cover more than 100 percent of U.S. purchases. The reason is that many goods covered by product exemptions are also USMCA-compliant—in effect, doubly protected from duty. The detailed data allow us to isolate the incremental impact of product exemptions. For Canada, product exemptions shielded an additional 9 percent of purchases from U.S. duties. The incremental impact for Mexico was smaller, at only 4 percent.
Looking Ahead
Recent executive orders keep in place key features of the tariff landscape outlined here. Exemptions for USMCA-compliant goods have been retained as have most product-based exemptions. High tariffs remain in place for steel and aluminum products.
To be sure, how U.S. tariff policy will evolve remains uncertain. Pending court decisions could limit or invalidate many current tariffs while the Administration is said to be studying alternative mechanisms for imposing new tariffs.
Absent dramatic moves, however, the recent pattern of realized tariff rates is likely to remain little changed. Tariffs on goods from China stand to remain quite high while tariffs for Canada and Mexico stand to remain quite low. One implication is that the already high share of U.S. imports coming from Canada and Mexico could climb still higher.

Matthew Higgins is an economic policy advisor in the Federal Reserve Bank of New York’s Research and Statistics Group.

Thomas Klitgaard is an economic policy advisor in the Federal Reserve Bank of New York’s Research and Statistics Group.
How to cite this post:
Matthew Higgins and Thomas Klitgaard, “A Country‑Specific View of Tariffs,” Federal Reserve Bank of New York Liberty Street Economics, October 6, 2025, https://doi.org/10.59576/lse.20251006
BibTeX: View |


Disclaimer
The views expressed in this post are those of the author(s) and do not necessarily reflect the position of the Federal Reserve Bank of New York or the Federal Reserve System. Any errors or omissions are the responsibility of the author(s).
 RSS Feed
 Follow Liberty Street Economics
Fantastic analysis – thanks