


Bank failures and distress can be costly to the economy, causing losses to creditors and reducing the flow of credit and other financial intermediation services. Thus, there is significant value in being able to identify “at risk” banks in a timely and accurate way. In a previous post, we presented a new solvency metric, Economic Capital, and showed how solvency risks in the U.S. banking industry have evolved over time according to this measure. In this post, we continue to draw on our recent Staff Report to present analysis showing that Economic Capital identifies failing banks earlier and more accurately than more conventional solvency measures.
An Overview of Economic Capital
As an alternative to more traditional measures of bank solvency such as regulatory capital and tangible common equity (TCE), we propose and develop a measure of economic capital (EC). EC is calculated using estimates of the present value of bank assets, liabilities, and necessary operating expense. EC embeds changes in the value of bank assets and liabilities due to changes in interest rates and credit spreads over time, in contrast to more traditional solvency measures based on accounting principles, which do not consistently recognize changes in value before contractual maturity. We calculate EC using publicly available regulatory data for nearly all U.S. commercial banks over a long historical period from 1997 to the beginning of 2025.
As discussed in our prior post, EC has several conceptual and computational advantages relative to measures based on accounting principles. Of particular interest, we can calculate R-EC, or the value of EC under the assumption that uninsured depositors will run on the bank. This measure provides insight into whether banks would continue to be solvent in such circumstances.
Better Identification of Failing Banks?
While EC has certain conceptual advantages, does it really do a better job of identifying failing banks earlier or more accurately than accounting-based solvency measures? To address this question, we consider failures during the March 2023 period, when sharp increases in interest rates decreased the value of bank assets, leading to runs and the failure of four large banks. We examine all failing banks between 1997 and 2025, a sample that is dominated by credit-related failures during the 2007-2009 Global Financial Crisis (GFC).
Test Case: March 2023 Banking Stress Episode
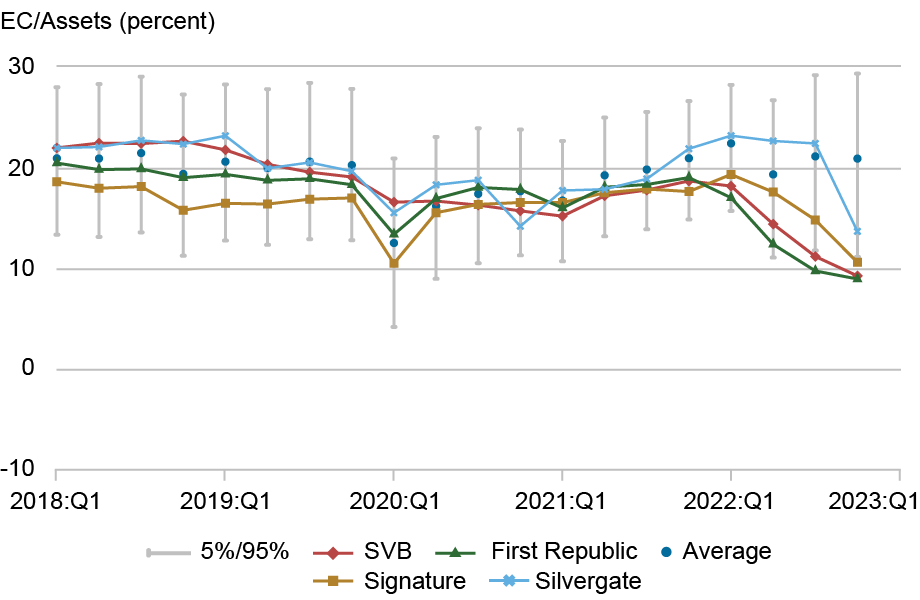
The chart below tracks four solvency measures in the five years before March 2023. The four measures are our baseline EC measure, R-EC, TCE, and TCE adjusted for estimated losses on loans and securities (MTM TCE). Each measure is scaled by total bank assets to create a leverage ratio-type metric. The chart shows the path of each measure for the four banks that failed during this episode—Silicon Valley Bank (SVB), First Republic, Silvergate, and Signature Bank—along with the 5th to 95th percentile range of each measure for all banks in our sample (“the industry”).
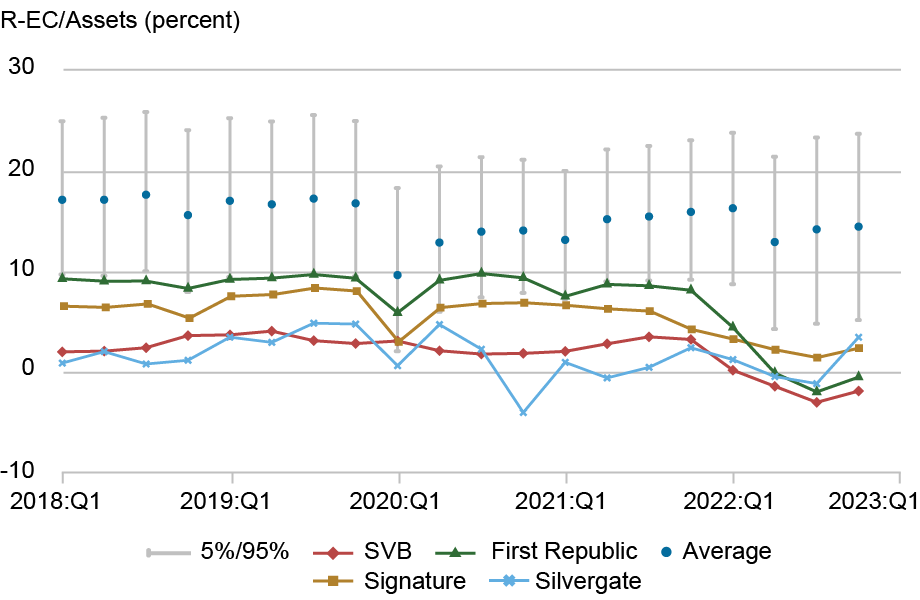
As the top left panel shows, while the failing banks have low EC ratios, they were not stark outliers with respect to the overall distribution of banks until interest rates began to rise in 2022. In contrast, R-EC ratios for these banks are notably low—sometimes below 5th percentile values—as far back as five years before the industry became stressed in 2023. In fact, the R-EC ratios for SVB and First Republic were negative by mid-2022.
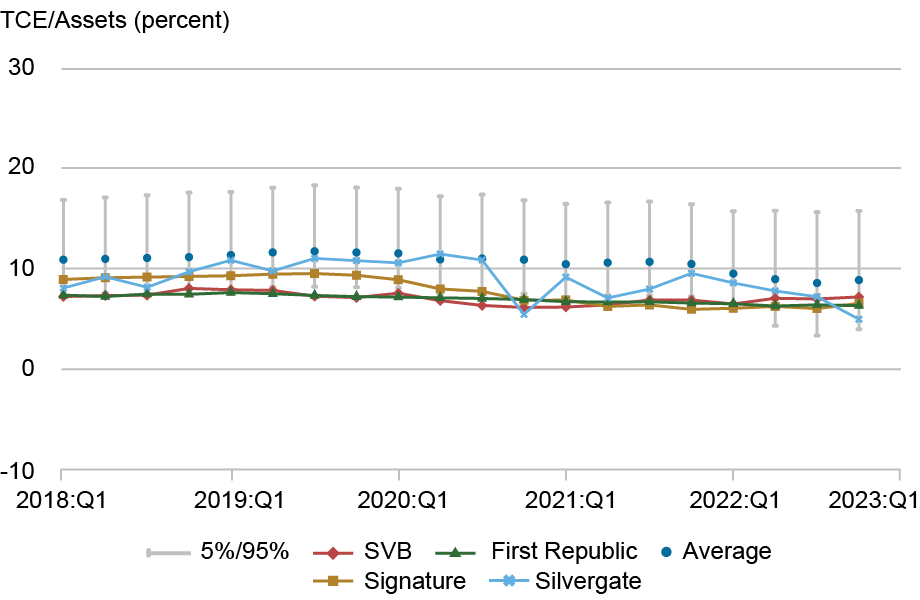
Overall, R-EC signaled a high risk of insolvency at these banks under a run scenario well ahead of actual events. In contrast, neither of the accounting-based TCE measures provided as clear a signal. While TCE ratios for the failing banks were below industry averages, they were within the 5th–95th percentile range for the entire period. In fact, MTM TCE ratios for these firms actually rose in the distribution—for Silvergate and Signature Bank, to levels above the industry average—over the course of 2022. While the level of MTM TCE ratios for these firms fell in absolute terms, they fell by less than the industry average, illustrating the shortcomings of marking only one side of the balance sheet to market.
Failed-Bank Solvency Measures
EC
R-EC
TCE
MTM TCE
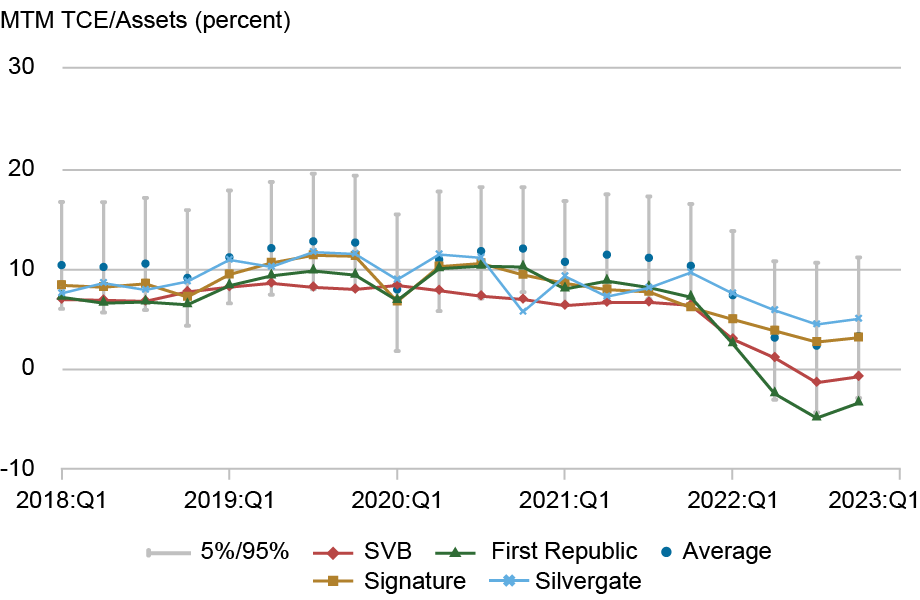
Sources: Call Reports; authors’ calculations.
Notes: The chart shows four solvency measures from 2018:Q1 to 2022:Q4 for the four banks that failed or were liquidated in the March 2023 period of banking industry stress. The solvency measures are economic capital (EC), run economic capital (R-EC), tangible common equity (TCE), and mark-to-market TCE (MTM TCE). The four banks are Silicon Valley Bank (SVB, in red), First Republic (in green), Signature (in orange), and Silvergate (in blue). The grey bars are the 5th to 95th percentile range for all commercial banks with assets greater than $50 million, excluding trust banks.
Is It Just Interest Rate Risk?
While the analysis thus far suggests that R-EC did a better job of anticipating which banks would fail in 2023, this finding may reflect the characteristics of that particular episode rather than a broader capability to accurately identify failing banks. To address this concern, we consider all banks that failed at any time during our sample period, based on information from the FDIC. The resulting sample of 465 failed banks is dominated by failures during the GFC, as roughly two-thirds of the failures occurred from 2008 to 2010, largely reflecting credit losses—distinct from the interest-rate-driven market value losses that spurred the 2023 episode.
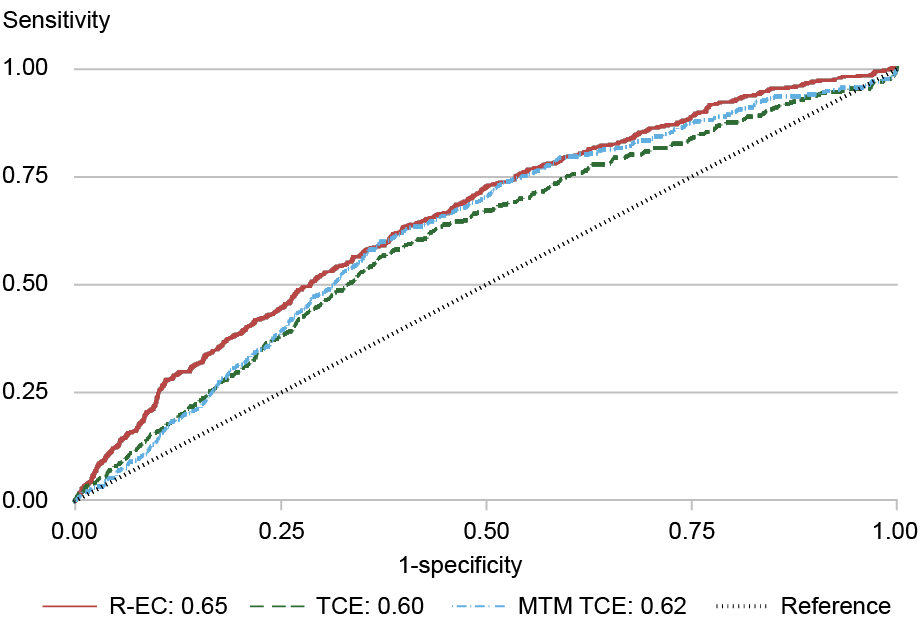
To explore how well the various solvency measures predict the broader set of bank failures, we estimate simple logit models, using a zero-one indicator of bank failure and values of R-EC, TCE, and MTM TCE, in turn, as the explanatory variable. (We do not report results for EC as they are very close to those for R-EC.) We estimate these models using solvency measures eight and twelve quarters prior to failure and use the resulting coefficients to construct “Receiver Operating Curves” (ROCs) showing the tradeoff between correctly identifying a failing bank (on the y-axis) and incorrectly identifying a non-failing bank as failing (on the x-axis). An ideal measure would correctly identify a high portion of failing banks but incorrectly identify only a small portion of non-failing banks, so curves that are sharply sloped and closer to the y-axis (with more area under the curve) indicate better performance of the metric in optimizing this tradeoff.
The chart below shows the ROCs for the three solvency metrics eight and twelve quarters before failure. At both horizons, R-EC is more accurate than the alternative solvency metrics, with differences at the eight-quarter horizon being particularly notable. In all cases, results for R-EC (the red lines) are steeper and closer to the y-axis than results for TCE and MTM TCE, which perform similarly to one another.
Receiver Operating Curves for Solvency Measures
8-quarter
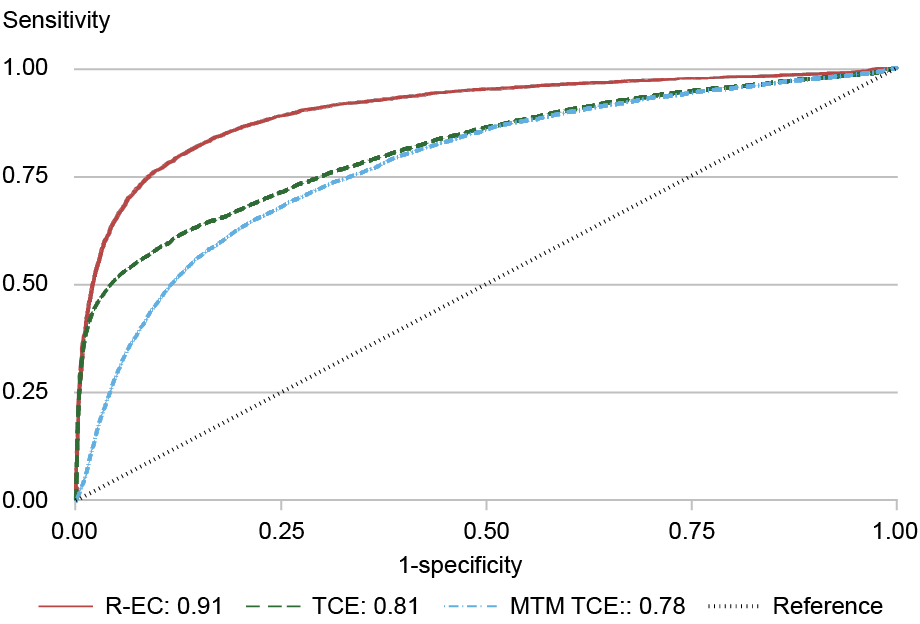
12-quarter
Source: Authors’ calculations.
Notes: The chart shows the receiver operating curves (ROCs) distinguishing banks that fail (on the y-axis) from banks that do not fail (x-axis) based on logit regressions using three solvency measures: run economic capital (R-EC), tangible common equity (TCE), and mark-to-market TCE (MTM TCE). The panels show the ROCs 8 quarters and 12 quarters before failure.
Summing Up
In this post, we present a range of results showing that our measure of Economic Capital is a more timely and accurate indicator of bank failure than more conventional accounting-based measures of bank solvency. Accounting-based measures are founded on the assumption that the bank will continue as a going concern and thus that the contractual timing of payments on assets and liabilities will prevail. Conceptually, this assumption does not capture circumstances in which depositors choose to withdraw their funds and thus is unlikely to provide strong signals about solvency under such circumstances. Economic Capital, in contrast, can be calculated under a bank run scenario to illustrate precisely this form of solvency risk. Our analysis supports the idea that this matters in practice by accurately identifying failing banks, indicating that Economic Capital could be a useful supplement to existing solvency metrics in monitoring both the health of individual banks and the risks facing the banking system.

Beverly Hirtle is a financial research advisor in the Federal Reserve Bank of New York’s Research and Statistics Group.

At the time this post was written, Matthew C. Plosser was a financial research advisor in the Federal Reserve Bank of New York’s Research and Statistics Group.
How to cite this post:
Beverly Hirtle and Matthew C. Plosser, “Economic Capital: A Better Measure of Bank Failure?,” Federal Reserve Bank of New York Liberty Street Economics, November 6, 2025, https://doi.org/10.59576/lse.20251106
BibTeX: View |


Disclaimer
The views expressed in this post are those of the author(s) and do not necessarily reflect the position of the Federal Reserve Bank of New York or the Federal Reserve System. Any errors or omissions are the responsibility of the author(s).
 RSS Feed
 Follow Liberty Street Economics