


In 2025, the Federal Reserve has cut interest rates, trade policy has shifted abruptly, and economic policy uncertainty has increased. How have these developments affected the functioning of the key U.S. Treasury securities market? In this post, we return to some familiar metrics to assess the recent behavior of Treasury market liquidity. We find that liquidity briefly worsened around the April 2025 tariff announcements but that its relation to Treasury volatility has been similar to what it was in the past.
Why Treasury Market Liquidity Matters
The U.S. Treasury market is the largest securities market in the world, with nearly $30 trillion in marketable debt outstanding as of September 30. The market is used by the Treasury Department to finance the U.S. government, by the Fed to implement monetary policy, and by numerous financial institutions as a safe asset, to manage interest rate risk, and to value other securities. Liquidity is critical to all of these uses and is hence followed closely by both market participants and policymakers.
How We Measure Treasury Market Liquidity
Market liquidity can be defined as the cost of quickly converting an asset into cash (or vice versa) and may be measured in several ways. As in past work, we look at three common measures, estimated using high-frequency data from the interdealer market: the bid-ask spread, the order book depth, and the price impact. The measures are calculated for the most recently auctioned (on-the-run) two-, five-, and ten-year notes (the three most actively traded Treasury securities, as shown in this post) over New York trading hours (defined as 7:30 a.m. to 5 p.m., eastern time).
Liquidity Deteriorated in April 2025
The bid-ask spread is the difference between the lowest ask price and the highest bid price for a security, with a wider spread suggesting worse liquidity. Bid-ask spreads, shown in the chart below, widened notably after the April 2 tariff announcement, albeit to a much lesser extent than in March 2020 and even somewhat less than during the March 2023 regional banking turmoil. Bid-ask spreads then narrowed after the April 9 announcement that the new tariffs were mostly being postponed and have since been commensurate with levels typically observed in recent years.
Bid-Ask Spreads Widened in April 2025
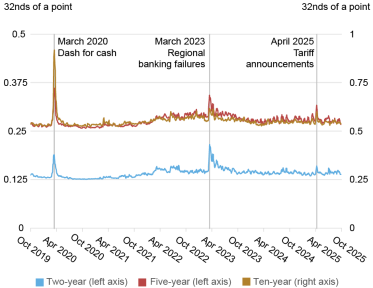
Notes: The chart plots five-day moving averages of average daily bid-ask spreads for the on-the-run two-, five-, and ten-year notes in the interdealer market from October 1, 2019, to September 30, 2025. Spreads are measured in 32nds of a point, where a point equals one percent of par. Vertical lines flag the peaks in the five-day moving average for the ten-year note, which are centered around March 16, 2020, March 15, 2023, and April 9, 2025.
The next chart plots order book depth, measured as the average quantity of securities available for sale or purchase at the best bid and offer prices. This metric also points to relatively poor liquidity in April 2025, when available depth declined to the lowest levels since March 2023. Depth then quickly recovered and by late summer 2025 was at levels similar to, if not better than, at any time since the start of the Fed’s post-COVID tightening cycle in March 2022.
Order Book Depth Dropped in April 2025
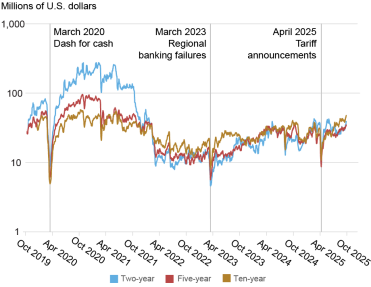
Notes: The chart plots five-day moving averages of average daily depth for the on‑the‑run two-, five-, and ten-year notes in the interdealer market from October 1, 2019, to September 30, 2025. Data are for order book depth at the inside tier, averaged across the bid and offer sides. Depth is measured in millions of U.S. dollars par and plotted on a logarithmic scale. Vertical lines flag the low points in the five-day moving average for the ten-year note, which are centered around March 16, 2020, March 15, 2023, and April 9, 2025.
Measures of the price impact of trades also suggest a sharp deterioration of liquidity in April 2025. The next chart plots the estimated price impact per $100 million in net order flow (defined as buyer-initiated trading volume less seller-initiated trading volume). A higher price impact suggests reduced liquidity. Price impact rose abruptly on April 2, but then quickly reverted. By late summer 2025, price impact was about as low as at any time since early 2022.
Price Impact Rose in April 2025
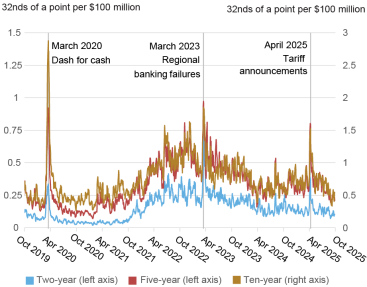
Notes: The chart plots five-day moving averages of slope coefficients from daily regressions of one-minute price changes on one-minute net order flow (buyer-initiated trading volume less seller-initiated trading volume) for the on-the-run two-, five-, and ten-year notes in the interdealer market from October 1, 2019, to September 30, 2025. Price impact is measured in 32nds of a point per $100 million, where a point equals one percent of par. Vertical lines flag the peaks in the five-day moving average for the ten-year note, which are centered around March 17, 2020, March 16, 2023, and April 9, 2025.
Liquidity Closely Tracks Volatility
A close negative relationship between Treasury liquidity and price volatility is well documented (see this study, for example). Volatility causes market makers to widen their bid-ask spreads and post less depth to manage the increased risk of taking positions. Volatility, in turn, is driven by uncertainty about the expected path of interest rates, reflecting uncertainty about economic growth, inflation, and policy, both fiscal and monetary.
As shown in the next chart, Treasury price volatility rose sharply following the April 2 tariff announcement, peaking between April 7 and April 9. Volatility then quickly declined after the April 9 announcement that the tariffs were being postponed. Volatility continued trending down in subsequent months, and—like the price impact—by late summer was roughly as low as at any time since early 2022.
Price Volatility Spiked in April 2025
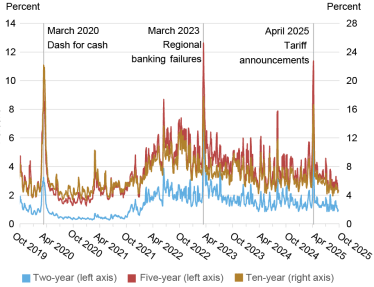
Notes: The chart plots five-day moving averages of price volatility for the on-the-run two-, five-, and ten-year notes in the interdealer market from October 1, 2019, to September 30, 2025. Price volatility is calculated for each day by summing squared one-minute returns (log changes in midpoint prices) from 7:30 a.m. to 5 p.m., annualizing by multiplying by 252, and then taking the square root. It is reported in percent. Vertical lines flag the peaks in the five-day moving average for the ten-year note, which are centered around March 11, 2020, March 14, 2023, and April 8, 2025.
As with Liberty Street Economics posts in 2022 and 2023, we assess whether liquidity has been unusual given the level of volatility by examining scatter plots of price impact against volatility. The chart below provides such a plot for the five-year note, showing that the 2025 observations (in dark blue) fall in line with the historical relationship. That is, the association between liquidity and volatility in 2025 has been consistent with the past association between these two variables; similar results are shown in the presentation accompanying this speech by Roberto Perli, manager of the System Open Market Account, using a somewhat different approach.
Liquidity and Volatility in Line with Historical Relationship
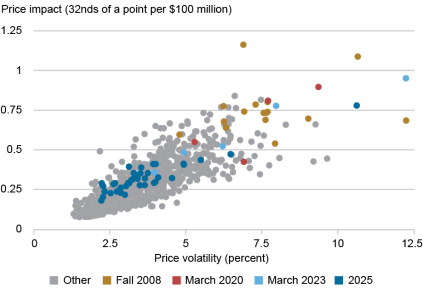
Notes: The chart plots price impact against price volatility by week for the on-the-run five-year note from January 2, 2005, to September 30, 2025. The weekly measures for both series are averages of the daily measures plotted in the preceding two charts. Fall 2008 points are for September 14, 2008–January 3, 2009, March 2020 points are for March 1, 2020–March 28, 2020, March 2023 points are for February 26, 2023–April 1, 2023, and 2025 points are for December 29, 2024–September 30, 2025.
Liquidity Bears Close Watching
Although U.S. Treasury market liquidity has not been unusual given the level of volatility, it still bears close watching. Liquidity is crucial to many essential uses of this important market, as noted earlier. Market liquidity has also experienced periodic disruptions, as shown above, and faces the ongoing challenge of growth in Treasury debt outstanding amidst limited dealer capacity. At the same time, policymakers have taken many steps to promote Treasury market resilience. It remains to be seen how these various developments will affect market functioning and liquidity.

Michael J. Fleming is head of Capital Markets in the Federal Reserve Bank of New York’s Research and Statistics Group.
How to cite this post:
Michael J. Fleming, “How Has Treasury Market Liquidity Fared in 2025?,” Federal Reserve Bank of New York Liberty Street Economics, November 12, 2025, https://doi.org/10.59576/lse.20251112
BibTeX: View |


Disclaimer
The views expressed in this post are those of the author(s) and do not necessarily reflect the position of the Federal Reserve Bank of New York or the Federal Reserve System. Any errors or omissions are the responsibility of the author(s).
 RSS Feed
 Follow Liberty Street Economics