


It is common for price measures to consider changes in quality. That is, a price index might fall even though listed prices are unchanged because the quality of the item has improved. An adjustment for quality captures the fact that consumers are effectively getting more for the same dollar when product quality rises. In practice, however, it is notoriously difficult to measure quality changes since it requires access to detailed data on all product characteristics that matter to consumers. We offer a novel method to infer quality changes and apply it to U.S. import price indices. When we account for quality improvements in this way, we find that the import price inflation based on official measures has been overstated, revealing that consumers have been getting more from their purchases of imported goods than what standard quality adjustments suggest.
Adjusting for Quality
So how can one address not having detailed information on product characteristics? In a recent paper we estimate quality change for a product by looking at changes in consumer demand for imports that are not accounted for by changes in prices.
Take a simple example. Our approach starts by estimating the elasticity of substitution between imports and domestically produced goods. That is, how responsive is the demand for imported goods if those prices rise by 10 percent relative to the producer price index (PPI) for domestic alternatives. An estimated elasticity of 1 would mean that the quantity sold would fall by 10 percent. If the data show that quantities sold only fell by 5 percent after that kind of jump in relative prices, then one can infer there was a partially offsetting improvement in quality. With that information, we can calculate an alternative import price index. Note that the PPI data are adjusted for quality improvements for several industries and we use this as a quality benchmark for adjusting import prices.
The next stage is to calculate import price indices for 155 individual industries, with the estimated elasticity of substitution allowed to vary across industries. These price series are then aggregated to create an overall import price index, seen in the chart below. While the published import price index rose 13 percent from 1989 to 2018, our alternative index fell 8 percent.
U.S. Import Prices Trend Lower When Adjusted for Higher Quality
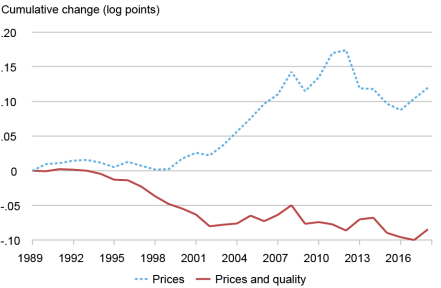
Notes: The chart plots the aggregate import price index and its decomposition into the price and quality components. The solid line represents the aggregate import price index including both the price and quality components. The dashed line represents the price component only. U.S. varieties are used to normalize the quality of imported goods.
One can further decompose quality improvements by industry, to examine which industries have been the most important drivers of higher quality. We find, not surprisingly, that imported machinery and electronic equipment (which includes computers and peripheral equipment) exhibit the strongest quality improvements.
Much of the Understated Quality Improvement Is in the Machinery and Electronics Industry
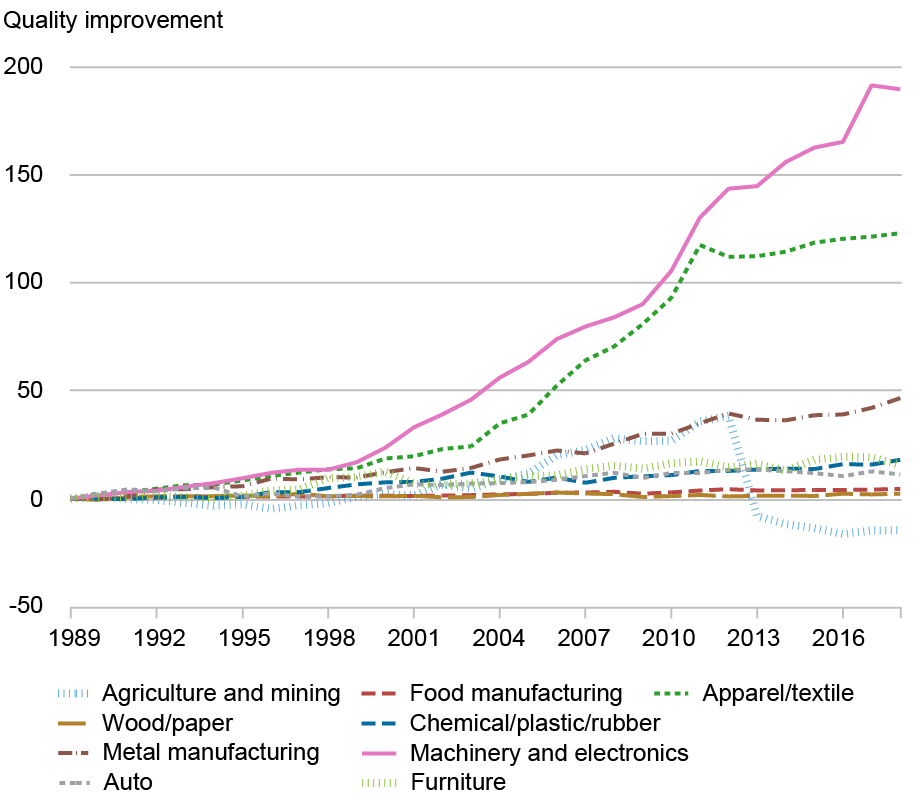
Notes: The chart plots the quality improvement index at the sectoral level. The index is constructed using the inferred quality at the variety level aggregated using a Tornqvist index.
The chart below shows the ratio of import to domestic prices rises without our quality adjustment and falls with our adjustments. This result resolves a puzzle—U.S. data show import volumes of these products moving higher even though import prices have been trending higher relative to domestic prices in the published data. With our quality adjustment, the costs of imported machinery and electronics are no longer rising relative to domestic prices, helping to explain the ever-increasing demand for these imported goods.
Quality Adjustment Implies Falling Relative Prices of Imported Computers Relative to Domestically Produced Alternatives
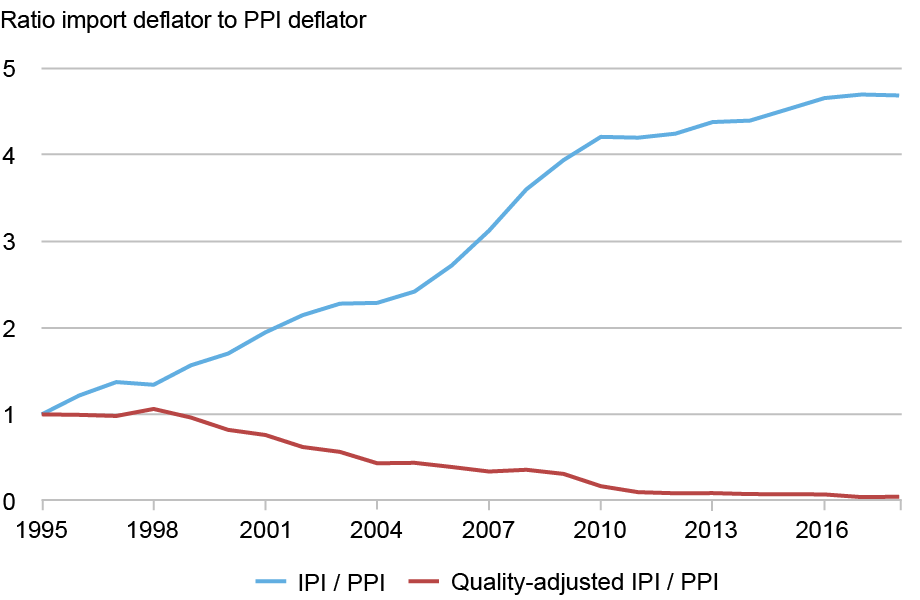
Notes: This chart plots the ratio between the import price index (IPI) and the producer price index (PPI) for the Computer and Peripheral Equipment sector (NAICS 3341). The producer price index is from the BLS. The blue line uses the official import price index from BLS, while the red line uses the import price index adjusted for the inferred quality from the Kimball specification.
Conclusion
This post deals with the issue of how to adjust price data for changes in quality. The approach presented here addresses this challenge with a novel method that uses customs records to infer quality change. The analysis shows that import price indices appear to substantially overstate import price inflation by failing to fully capture quality improvements.

Danial Lashkari is an economic research advisor in the Federal Reserve Bank of New York’s Research and Statistics Group.
How to cite this post:
Danial Lashkari, “Understating Rising Quality Means Import Price Inflation Is Overstated,” Federal Reserve Bank of New York Liberty Street Economics, January 14, 2026, https://doi.org/10.59576/lse.20260114
BibTeX: View |


Disclaimer
The views expressed in this post are those of the author(s) and do not necessarily reflect the position of the Federal Reserve Bank of New York or the Federal Reserve System. Any errors or omissions are the responsibility of the author(s).
 RSS Feed
 Follow Liberty Street Economics
I respect the concept but not following the methodology and it’s merits.