


How can we accurately measure changes in living standards over time in the presence of price inflation? In this post, I discuss a novel and simple methodology that uses the cross-sectional relationship between income and household-level inflation to construct accurate measures of changes in living standards that account for the dependence of consumption preferences on income. Applying this method to data from the U.S. suggests potentially substantial mismeasurements in our available proxies of average growth in consumer welfare in the U.S.
These insights and results are based on my recent research paper coauthored with Xavier Jaravel of the London School of Economics, which is forthcoming at the Quarterly Journal of Economics.
Background
Economic theory shows that we can approximate changes in living standards using straightforward formulas known as price and quantity indices. These indices combine observed data on changes in the quantities of what we consume and the prices of those items, and are widely used by statistical offices around the world to construct measures of overall inflation in the cost of living and growth in living standards. However, this approach hinges on a crucial assumption—that the composition of what we want to buy does not shift when our incomes do (see, for example, Diewert 1993). Unfortunately, this simplifying assumption, known as homotheticity or income invariance, does not match up with a host of real-world evidence on the dependence of consumption patterns on consumer income, going as far back as the work of Engel (1857). Recent evidence on inflation inequality—the strong relationship between income and household-level measures of inflation—underscores the importance of this problem.
Insight and Method
A conceptually coherent way to measure living standards is to fix a set of prices and calculate the monetary expenditure needed, under these prices, to achieve any level of consumer welfare as it changes over time. Let us refer to this concept as real consumption, to distinguish it from the nominal expenditure of the consumer under changing prices. For instance, consider a case where all prices rise at the same 2 percent rate from one year to the next due to general inflation. Here, a consumer whose nominal expenditure has risen by 5 percent only experiences a 3 percent increase in real consumption, if we fix the prices in the initial or the final year. The key question is how to calculate the corresponding measures of inflation and real consumption growth in real-world settings in which changes in prices vary across different goods and services.
If consumer preferences are income-invariant, everyone consumes the same basket of goods and services regardless of their income level. Over time, households adjust whether to consume more or less of each good or service based on how its price changes relative to others, but these adjustments are the same for everyone. Conventional price indices tell us how to average these price changes using the expenditure shares of different goods and services, and theory tells us we need to deflate the growth in nominal expenditure based on the value of this average, which is the standard measure of inflation.
In reality, households choose different baskets of goods and services that systematically depend, among other things, on their income. Therefore, we find different inflation measures for different households when we compute the price indices using each household’s own expenditure shares, something that should not happen under the conventional assumption of income invariance. In the data, we often find lower inflation measures for richer households, meaning that prices rise more slowly for luxuries—i.e., items that are more heavily purchased by richer consumers (see, for example, Hobijn and Lagakos 2005, McGranahan and Paulson 2006, Jaravel 2019, Avtar et al. 2022, and Chakrabarti et al. 2023). Therefore, these items are becoming relatively cheaper than the others over time. This implies that, if we fix the initial prices as our basis for measuring real consumption, households that experience rising income will be shifting their consumption toward items that are accumulating relative price declines. In other words, sustained inflation bias toward necessities—goods and services favored by poorer households—means that we need relatively lower rates of growth in nominal terms to maintain the same rate of growth in real consumption. Thus, when income is growing, consumers are actually better off than that suggested by all available measures of real consumption. The conventional measures of inflation and real consumption miss this mechanism altogether. This is even true of the more recent work on inflation inequality, partially cited above, that relies on household-specific price index formulas but does not explicitly account for income dependence.
As it turns out, there is a relatively easy fix for this problem. We can correct for the effects of this income dependence in preferences simply by estimating the relationship between household income and household-specific price indices. The slope of this relationship leads to a correction factor that we need to apply to the nominal expenditure growth after it is deflated by the household’s own price index. This method is fairly easy to implement and only requires access to widely available surveys of consumption expenditure at the household level. Moreover, it can be generalized to extend to other household characteristics, such as age, family size, and education, that (1) matter for the composition of their consumption expenditure, and (2) potentially vary over time at the household level.
Application to the U.S. Data
In the paper, we apply our approach to data from the United States and quantify the magnitude of the bias in conventional measures of real consumption growth that ignore the effects of income dependence in household preferences. We build a new linked dataset providing price changes and expenditure shares at a granular level from 1955 to 2019, across the different percentiles of household (pretax) income. This dataset combines several data sources, primarily drawing from disaggregated data series available from the Consumer Price Index (CPI) and the Consumer Expenditure Survey (CEX). This new linked dataset allows us to provide evidence on the inequality in inflation over a long time horizon, thus extending prior estimates that have focused on shorter time series.
Computing inflation using income-percentile-specific price index formulas, we find that inflation inequality is a long-run phenomenon. For instance, as the chart below shows, we find that cumulative inflation from 1955 to 2019 varies substantially for households with different levels of income: while prices have inflated by a factor of around 10 for the bottom income groups, they have inflated by a factor closer to 8 at the top of the income distribution. The gap in inflation experienced by different income percentiles is sizable when compared to the overall size of inflation over the period. As such, when we look into the past from the perspective of today’s prices, we observe that (1) households were on average poorer sixty-five years ago—that is, they had stronger preferences for necessities; and (2) necessities were cheaper relative to luxuries. These empirical patterns imply that consumer welfare was higher sixty-five years ago when accounting for the dependence of preferences on income.
Inflation Inequality over the Long Run
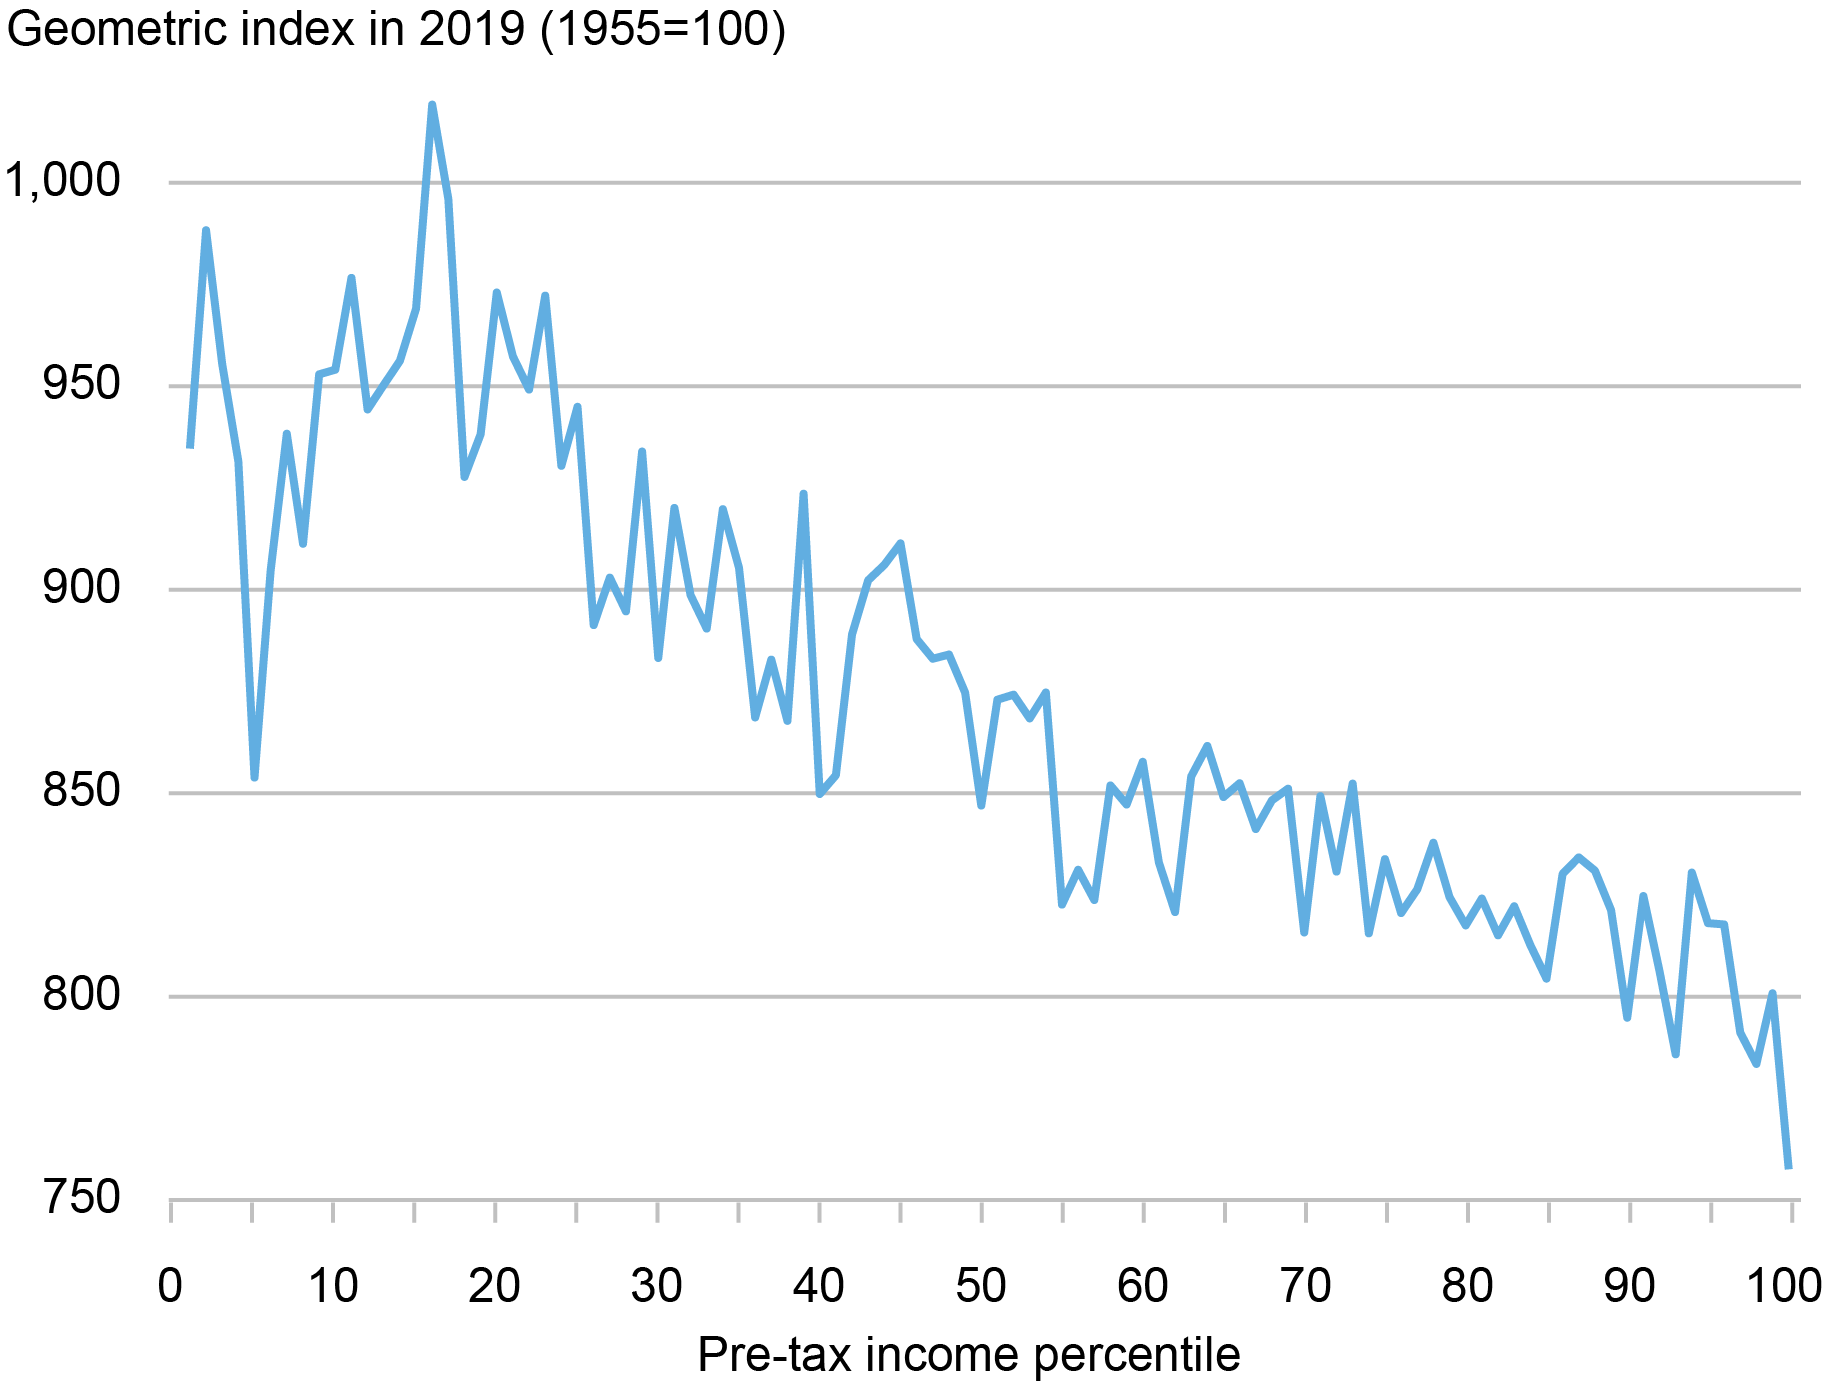
Source: Author’s calculations based on the historical linked CEX-CPI data.
Notes: This chart shows the patterns of inflation inequality in the data. It shows the cumulative inflation rates between 1955 and 2019 by pretax income percentiles.
When we apply our new method to this data, we find that the magnitude of the correction in measured welfare growth due to the effect of income-dependent preferences can be large. For example, as the chart below shows, by fixing prices in 2019 as the basis of defining real consumption, we find that the uncorrected measure underestimates average real consumption (per household) in 1955 by about 11.5 percent. Note that, by definition, the error is zero in the base year and accumulates over time as we move in time—in this case backward—away from the base year. For comparison, we also show the results if we fix prices in 1984. In this case, the bias is smaller simply because it accumulates over a shorter time period, as we move away from the base year in our data.
Bias in Conventional Measures of Average U.S. Real Consumption (1955-2019)
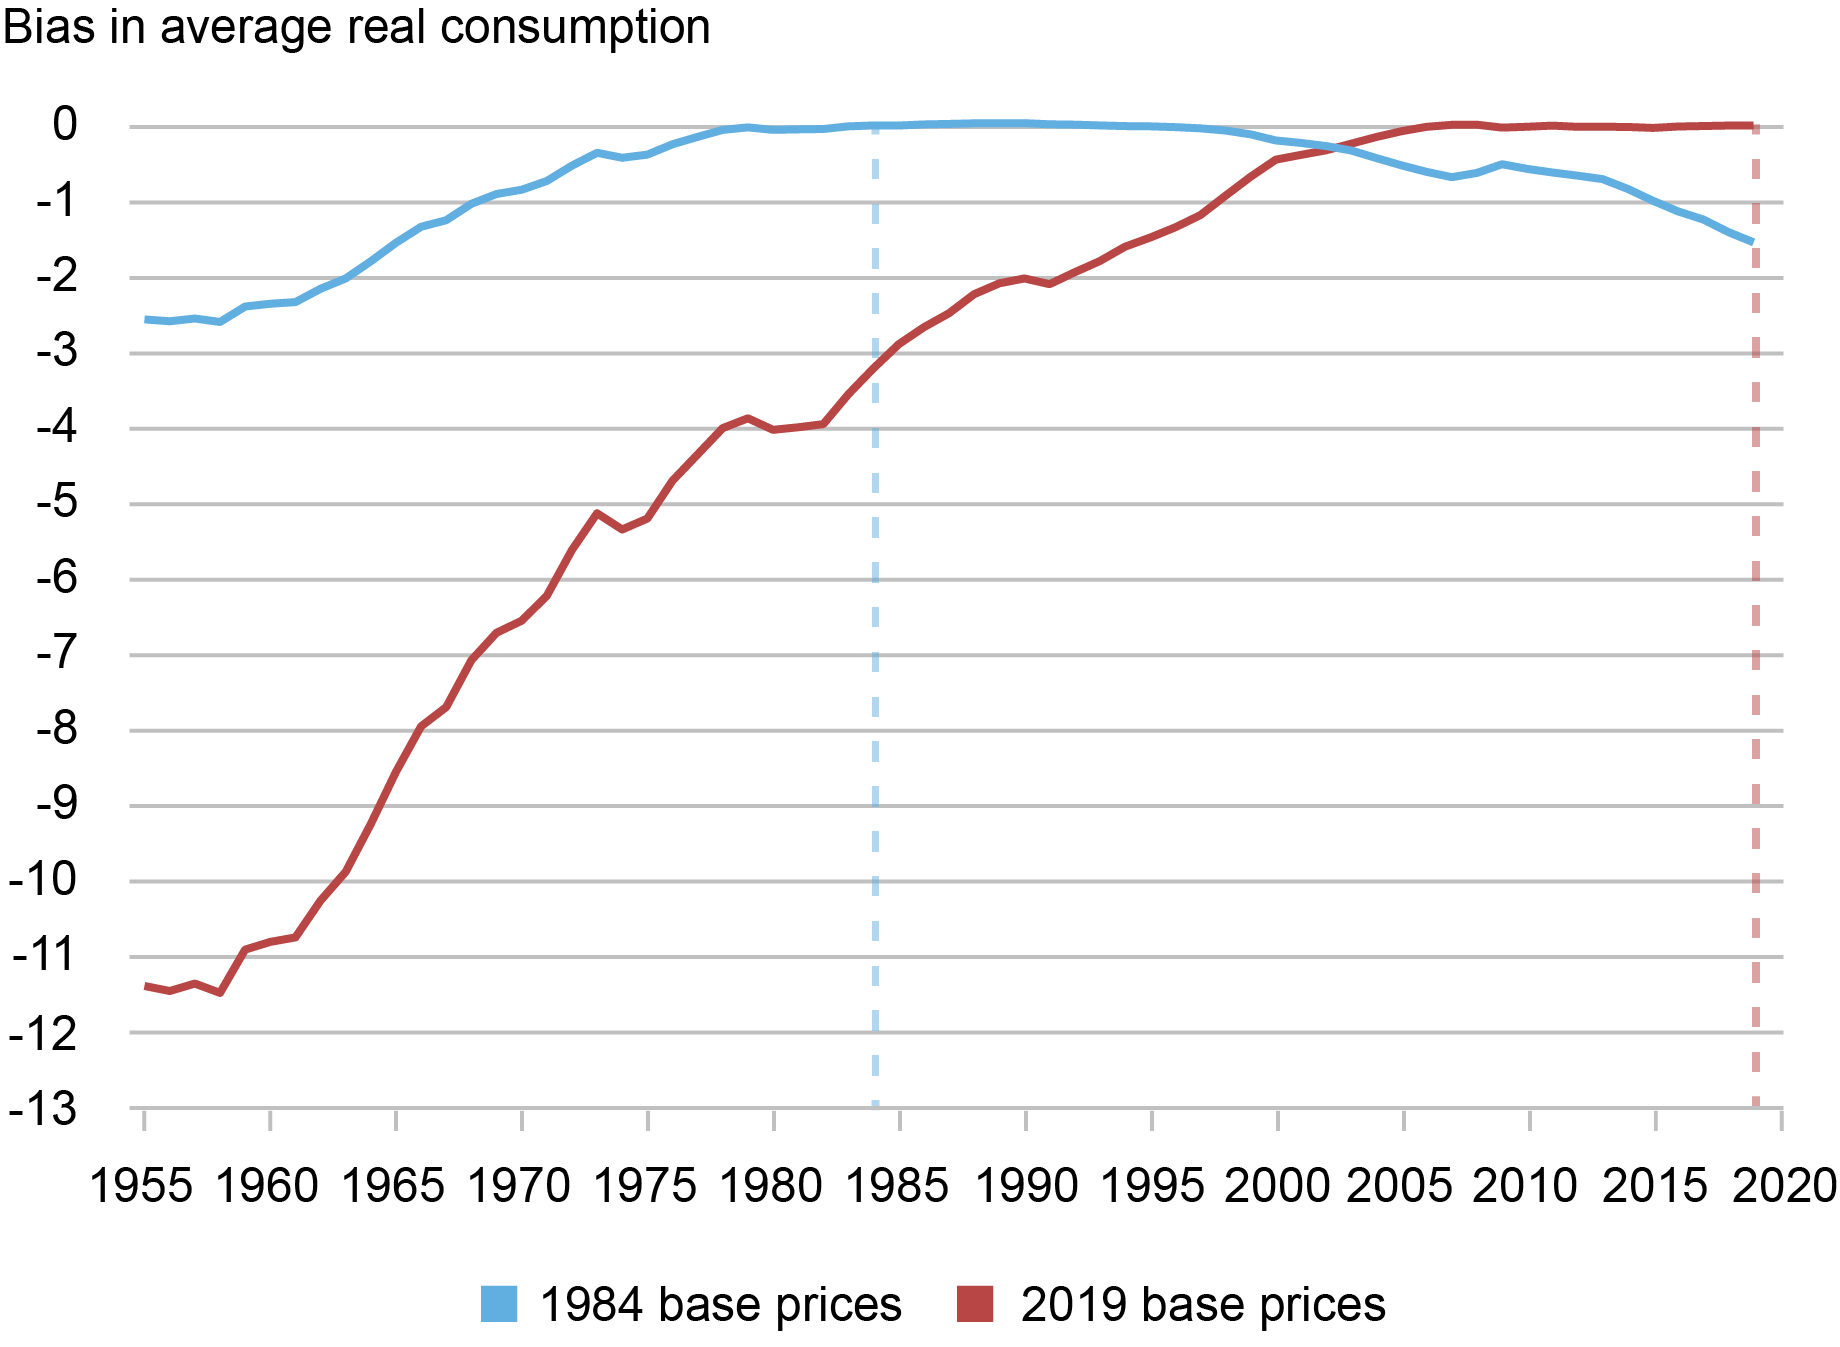
Source: Author’s calculations based on the historical linked CEX-CPI data.
Notes: This chart reports the biases in the level of average real consumption per household in conventional measures of real consumption, when compared against the corrections implied by our method, under two choices for the fixed prices as the base for calculation of real consumption: prices in 1984 and in 2019.
Of course, bias in measuring the level of real consumption leads to corresponding biases in the estimated growth. As the chart above already indicates, if we fix prices in the most recent year (2019), the conventional estimates overestimate the rate of growth in average real consumption due to the negative bias in the levels. In particular, the uncorrected measure of cumulative real consumption growth is 270 percent over the entire 1955-2019 period, or 2.07 percent growth annually. In contrast, with our correction for income dependence and under 2019 base prices, cumulative consumption growth falls to 232 percent, or an annualized growth rate of 1.89 percent per year. Thus, in this case we find that the annual growth rate from 1955 to 2019 is lowered by 18 basis points (2.07 percent − 1.89 percent).
Note that, since the conventional measure always underestimates the level of real consumption, the sign of the error in measured growth of real consumption depends on the choice of the base prices. For instance, if we instead fix 1984 prices as our base, the chart shows that the conventional measures in fact underestimate the growth in real consumption between 1984 and 2019. In other words, since preferences are income-dependent, measured growth in real consumption should in principle depend on the choice of fixed prices to express the measure.
Finally, we also apply our generalized method to quantify the adjustment to average real consumption implied by consumer aging in the United States. In this case, we reconstruct our measures of inflation by deciles of age and income by, first, defining ten deciles of the (pretax) income and, then, computing ten age deciles within each income decile. Using this data, as the chart below illustrates, we document a strong positive relationship between consumer age and inflation, which alters the measurement of real consumption because the average consumer age increases over time. We find that the implied adjustments to real consumption are economically meaningful but much smaller than the correction due to income dependence, which justifies our focus on the latter.
Consumer Aging and Real Consumption (1955-2019)
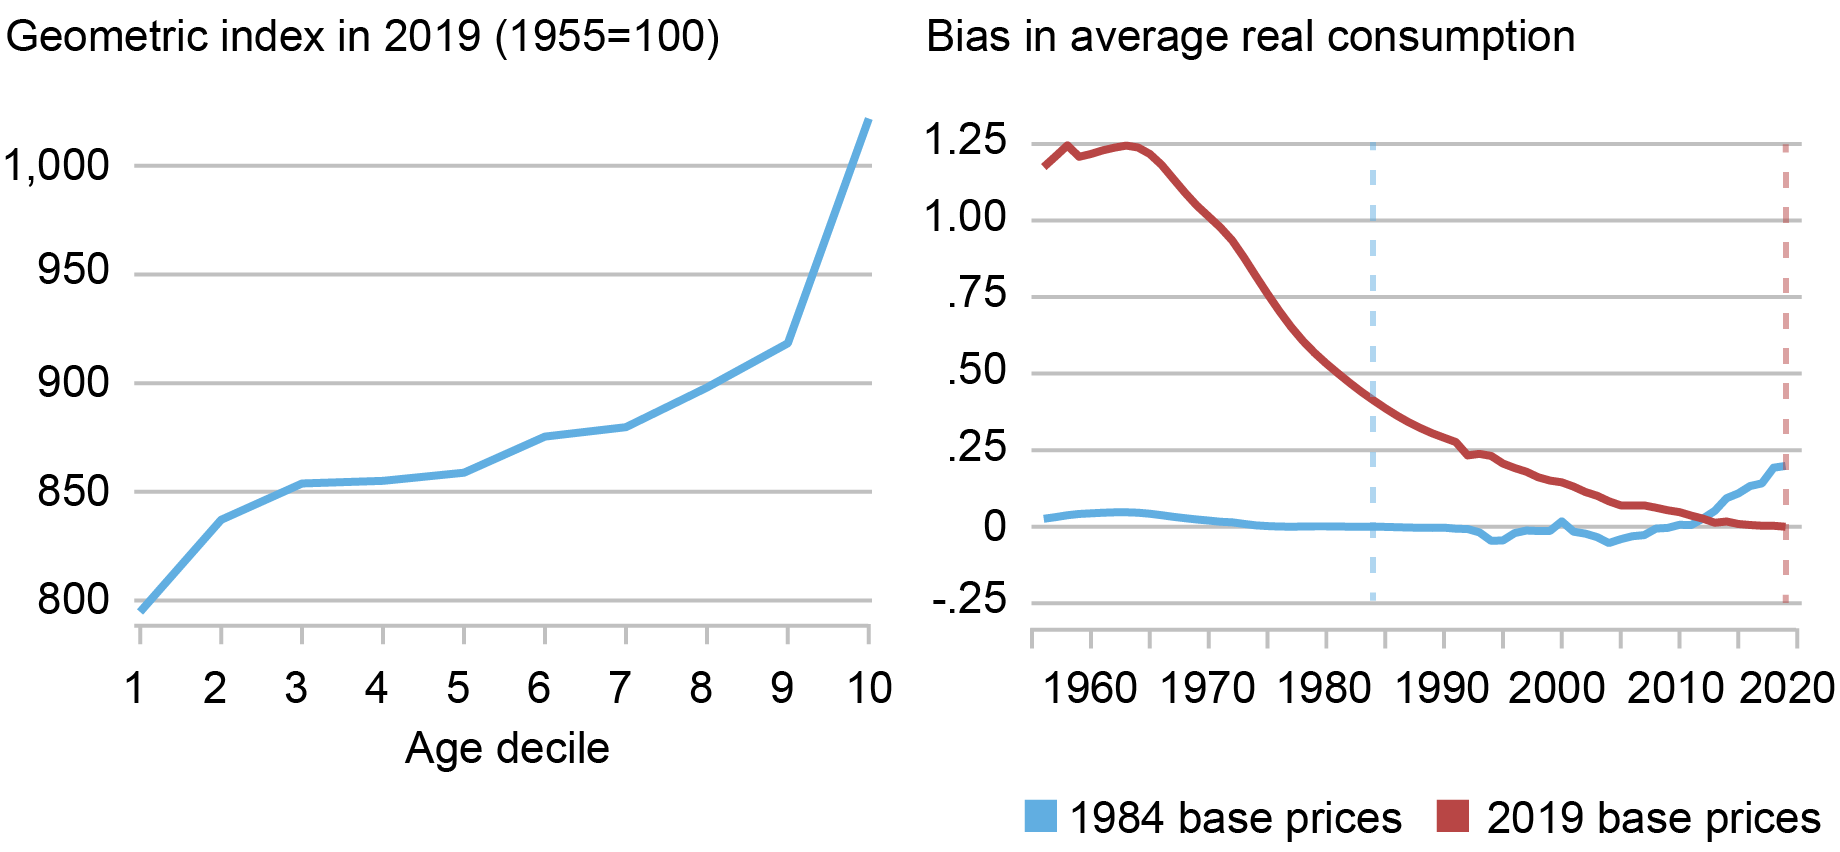
Sources: Author’s calculations based on the historical linked CEX-CPI data.
Notes: The left panel of the chart reports the cumulative inflation in the United States, from 1955 to 2019, for each decile of age. The right panel reports the implied bias in the average level of real consumption per household in conventional measures of real consumption, when compared against the corrections implied by our method due to aging, under two choices for the fixed prices as the base for calculation of real consumption: prices in 1984 and in 2019.
Conclusion
Our results may have important implications for the way in which national statistical agencies around the world construct measures of inflation and real economic value. In particular, the empirical results presented above suggest an approach that the Bureau of Labor Statistics (BLS) can use, based on already available data, to construct improved measures of real consumption growth and inequality in the U.S. In addition to improving the measurement of long-run growth and inflation inequality, our new approach can have important policy implications, such as the indexation of the poverty line and a more efficient targeting of welfare benefits. This approach also provides a blueprint for distributional national accounts (Piketty et al. 2018) that account for inflation inequality and income dependence in household preferences.

Danial Lashkari is a research economist in Labor and Product Market Studies in the Federal Reserve Bank of New York’s Research and Statistics Group.
How to cite this post:
Danial Lashkari, “Measuring Price Inflation and Growth in Economic Well‑Being with Income‑Dependent Preferences,” Federal Reserve Bank of New York Liberty Street Economics, January 8, 2024, https://libertystreeteconomics.newyorkfed.org/2024/01/measuring-price-inflation-and-growth-in-economic-well-being-with-income-dependent-preferences/
BibTeX: View |
Disclaimer
The views expressed in this post are those of the author(s) and do not necessarily reflect the position of the Federal Reserve Bank of New York or the Federal Reserve System. Any errors or omissions are the responsibility of the author(s).
 RSS Feed
 Follow Liberty Street Economics
Happy Tuesday Danial Lashkari!
Great post. This little nugget of information (…lower inflation measures for richer households, meaning that prices rise more slowly for luxuries), will be added to our models. Thanks!
Danial, any thoughts on the Buy Now/ Pay Later options that American consumers are loving right now?