


China has spent considerable government resources to develop advanced electric technology industries, such as those that produce electric vehicles, lithium batteries, and solar panels. These efforts have spilled over to international trade as improvements in price and quality have increased the global demand for these goods. One consequence is that passenger cars and batteries have been disproportionately large contributors to the rise in the country’s trade surplus in recent years. This has not been the case, though, for solar panels, as falling prices due to a supply glut pulled down export revenues despite higher volumes.
Industrial Policies
The use of industrial policies to promote advanced electric technology started in response to concerns about pollution and then transitioned into being part of China’s efforts to be at the vanguard of new technologies. The Five-Year Plan approved in 2011 committed to increasing the share of electricity provided by non-fossil fuels. The 2016 Plan focused on promoting environmental technology industries, specifically mentioning electric vehicles and renewable energy, and the 2021 Plan set a goal of half of all passenger cars sold in China being battery powered by 2035.
The various policies used have been expensive, but the efforts have led to rapid growth in these technologies. Plug-in cars (battery electric and plug-in hybrid) represented 54 percent of passenger cars sold in China in 2025, up from 28 percent in 2022, while China added 360 gigawatts (GW) of solar power capacity in 2024, compared to the 100 GW added in 2022.
One consequence of this rapid growth is that some of the new capacity has gone to satisfy foreign demand.
Motor Vehicles
Meeting the 50 percent goal ten years early illustrates how unexpectedly fast the plug-in passenger car industry has grown. The numbers are impressive. Battery electric vehicle production increased from 1 million units in 2020 to 9.5 million units in 2025, and the output of plug-in hybrids increased from 200,000 units to over 4.5 million units.
China has historically not exported passenger cars to global markets, so pouring money into the development of plug-in vehicles was a chance to leapfrog established auto firms. Exports of plug-ins, which totaled $3 billion in 2020, rose to $23 billion in 2022 and $59 billion in 2025, as shown in the chart below, despite tariffs closing off the U.S. market. (The data are twelve-month rolling sums, meaning each data point represents sales over the past twelve months.) Trade flows were also affected on the import side as increased demand for domestically produced plug-ins helped cause imports of passenger cars to fall from $52 billion in 2022 to $23 billion last year.
China’s Electric Passenger Car Exports Have Soared
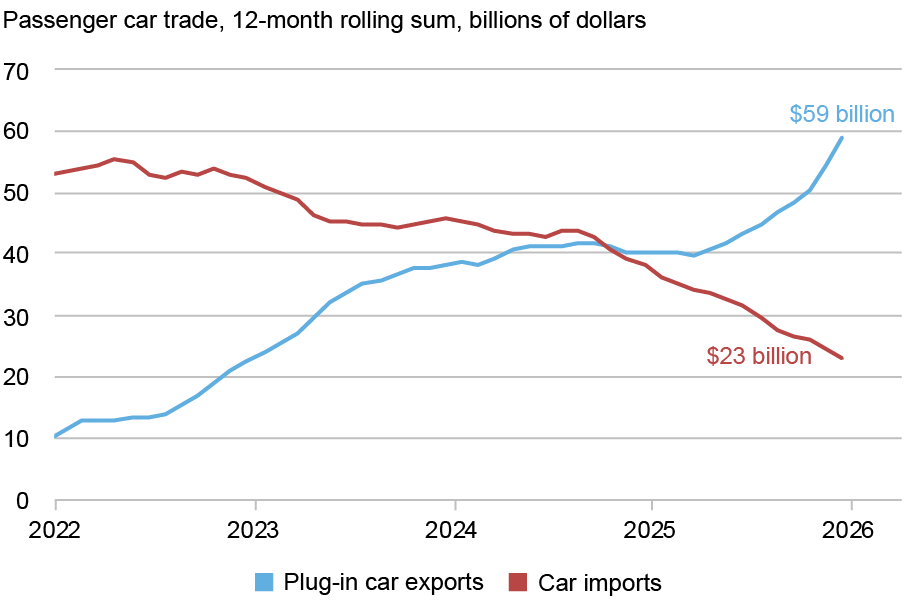
In terms of the trade balance’s composition, the rise in plug-in car exports and the decline in passenger car imports, both representing very small shares of total trade flows, contributed $65 billion to the $270 billion increase in China’s trade surplus from 2022 to 2025.
Lithium-Ion Batteries
Progress in producing better and cheaper lithium-ion batteries has been the key factor behind the rise of electric vehicles. One implication is that plug-ins assembled elsewhere often use batteries made in China. Foreign demand is also coming from the need to manage the world’s growing reliance on solar and wind power.
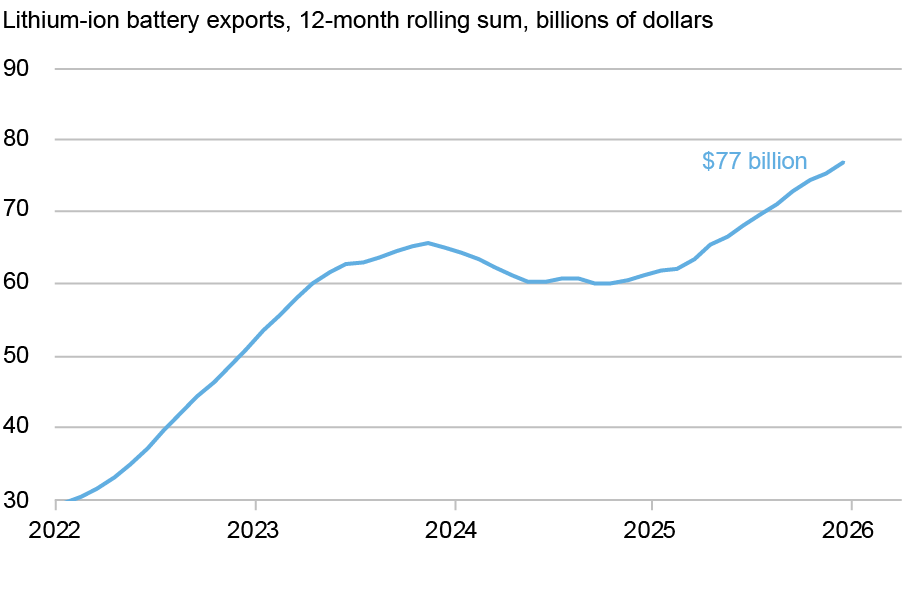
The chart below shows the upward trend in battery exports, albeit with a pause in 2024 after surging the previous year, putting 2025 foreign sales 50 percent higher than they were in 2022 ($51 billion to $77 billion). Imports during this period were negligible, so batteries also made a disproportionately large contribution to China’s higher trade surplus.
China’s Battery Exports Are Trending Higher
The global dominance of Chinese firms is evident in import data reported by other countries. The United States and the European Union (EU) both bought around $25 billion worth of lithium-ion batteries in 2024 (HS commodity code 850760), with China supplying 70 percent of U.S. imports and 86 percent of the EU’s purchases. The shares were similarly high for other importers such as India (91 percent), Pakistan (99 percent), Brazil (80 percent), and Saudi Arabia (98 percent).
Solar Panels
The rest of the world has been investing in solar power, with estimates that capacity additions went from 150 GW in 2022 to 250 GW in 2024. Despite more investment spending abroad, though, China’s solar panel export revenues fell 40 percent between 2022 and 2025, from $46 billion to $28 billion.
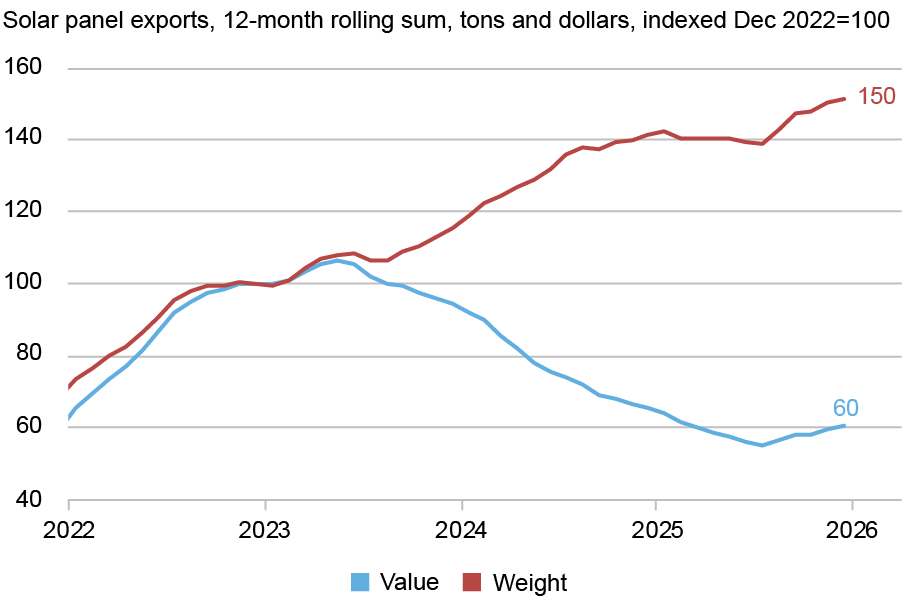
The chart below compares export revenues with export volumes, measured by weight, with both series set to equal 100 in 2022. Driving the co-movement of these lines are changes in prices. For example, if the price per pound is unchanged, then the two lines move together, as is the case from 2022 through the first half of 2023. (Trade data limitations prevent using the standard price per watt measure.) Alternatively, when prices fall, in this case from a supply glut that intensified competitive pressures, then revenues fall even though volumes are rising, as seen in the second half of 2023 and in 2024. Prices stabilized somewhat in 2025, so the value and the weight measures both moved higher.
Solar Panel Export Revenues Are Down While Weight Volumes Are Up
Falling prices have been a drag on revenues, but the aggressive cost competitiveness has allowed China to maintain almost total dominance in international trade in solar panels. In 2024, Chinese panels (HS commodity code 854143) accounted for almost all of the EU’s imports, with similarly high percentages recorded in India (80 percent), Pakistan (100 percent), Brazil (100 percent), and Saudi Arabia (100 percent).
High trade barriers mean the United States does not import panels from China, though U.S. panel imports were still substantial in 2024 at $15 billion versus $12 billion by the EU, with the bulk coming from other East Asian countries. The 2025 tariff hikes then caused imports to collapse, with the U.S. managing the cutoff by adding solar power capacity at a slower pace and by increasing the domestic production of assembled solar panels.
Outlook
Advanced electric technology products are enjoying growing demand around the world as China’s policies have helped lower prices and improve the quality of these goods. China’s dominance in global trade in electric technologies seems likely to be sustained in the near term, with competition at this point largely from other East Asian economies. The issue is complicated for governments that want to challenge China’s dominance as they will have to consider the costs and benefits of fostering domestic alternatives.

Thomas Klitgaard is an economic policy advisor in the Federal Reserve Bank of New York’s Research and Statistics Group.
How to cite this post:
Thomas Klitgaard, “China’s Electric Trade,” Federal Reserve Bank of New York Liberty Street Economics, March 23, 2026, https://doi.org/10.59576/lse.20260323
BibTeX: View |


Disclaimer
The views expressed in this post are those of the author(s) and do not necessarily reflect the position of the Federal Reserve Bank of New York or the Federal Reserve System. Any errors or omissions are the responsibility of the author(s).
 RSS Feed
 Follow Liberty Street Economics