Matthew Higgins and Thomas Klitgaard
Foreign investors placed roughly $1.0 trillion in U.S. assets in 2011, pushing the total value of their claims on the United States to $20.6 trillion. Over the same period, U.S. investors placed $0.5 trillion abroad, bringing total U.S. holdings of foreign assets to $16.4 trillion. One might expect that the large gap of -$4.2 trillion between U.S. assets and liabilities would come with a substantial servicing burden. Yet U.S. income receipts easily exceed payments abroad. As we explain in this post, a key reason is that foreign investments in the United States are weighted toward interest-bearing assets currently paying a low rate of return while U.S. investments abroad are weighted toward multinationals’ foreign operations and other corporate claims earning a much higher rate of return.
The U.S. Bureau of Economic Analysis collects detailed annual data on U.S. foreign assets and liabilities, measured at year-end. (See summary in the chart below.) According to these data, at the close of 2011, 44 percent of U.S. foreign holdings were in generally low-yielding, interest-bearing assets, compared with 71 percent of foreign claims on the United States. (These figures exclude U.S. financial derivative assets and liabilities, which net roughly to zero.) Some 29 percent of U.S. cross-border holdings were in higher-yielding foreign direct investments (FDI), which are investments in multinationals’ foreign subsidiaries as well as large minority stakes in foreign companies, versus just 14 percent of U.S. liabilities. Finally, 25 percent of U.S. overseas investments were in portfolio equity holdings, which tend to pay dividends somewhat above market interest rates, while just 15 percent of foreign holdings in the United States were in portfolio equities.
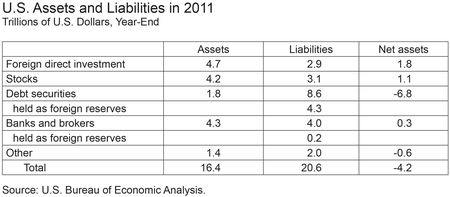
The marked difference in the composition of U.S. international assets and liabilities reflects historical investment patterns. For example, out of $1.0 trillion in foreign investment in U.S. assets in 2011, $0.4 trillion went for purchases of U.S. Treasury securities, with almost half by foreign central banks and other official investors. In addition, banks and securities brokers reported inflows of $0.3 trillion. Just $0.2 trillion went to FDI in the United States, with relatively small purchases of U.S. corporate bonds and stocks making up the balance. In contrast, of the $0.5 trillion spent by U.S. investors on foreign assets, some $0.4 trillion went to FDI and $0.1 trillion was placed in foreign stock markets. Outflows in other categories netted roughly to zero, with U.S. government lending to foreign central banks through swap arrangements and U.S. private investment in foreign corporate bonds offset by a $0.2 trillion reduction in foreign positions reported by U.S. banks and securities brokers.
The size and composition of U.S. assets and liabilities are also affected by asset price and exchange rate movements over time. For example, asset price changes left a large mark in 2011, subtracting $0.5 trillion from the value of U.S. holdings of foreign assets, largely due to slumping global equity markets. (See chart below.) Over the same period, price changes added $0.3 trillion to the value of foreign holdings of U.S. assets, with lower interest rates boosting the prices of U.S. bonds. Exchange rate movements had a minor impact on the net asset position in 2011. Methodological and other reporting changes reduced the net asset position by $0.2 trillion.
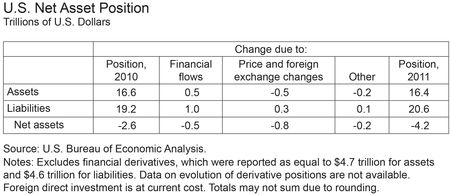
The large negative impact of asset prices changes on the U.S. net asset position in 2011 represents a break from the trend of recent years. From year-end 2002 to year-end 2010, favorable asset price changes boosted the net asset position by $1.3 trillion. A weaker dollar also helped, improving the net position by some $0.6 trillion. (A weaker dollar bolsters the asset position by raising the value of U.S. assets held in euros and other foreign currencies when translated into dollar terms.) Methodological improvements were also a major factor, with new source data showing U.S. assets abroad to be more than $2.7 trillion higher than originally reported and foreign claims on the United States to be $0.7 trillion higher than originally reported. (These figures are for cumulative revisions reported over a number of years.)
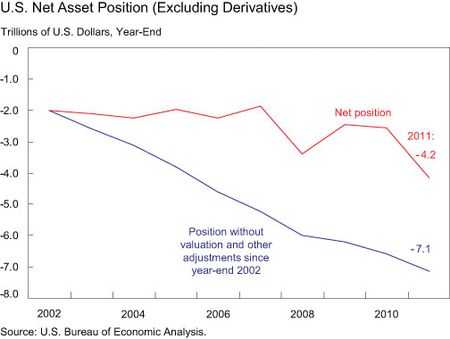
The United States booked a record $235 billion surplus on its net asset portfolio in 2011, despite the -$4.2 trillion net asset position at the end of that year. The source of this surprising bounty lies in the marked differences in the composition of U.S. assets and liabilities discussed above, as well as in a superior U.S. rate of return on FDI holdings.
Higher U.S. Returns
A measure of rates of return can be calculated by combining balance-of–payments-data on income receipts and payments with data on investment positions. Last year, U.S. investors saw a rate of return of 1.7 percent on foreign fixed-income securities, bank deposits, and similar assets, while foreign investors earned 1.9 percent on interest-bearing assets in the United States. (Rates of return for U.S. interest-bearing assets and liabilities have generally moved together because both are denominated largely in dollars. See the chart below.) The current low-interest-rate environment, as well as the fact that 71 percent of foreign investments in the United States are in interest-bearings assets, held U.S. net income in this category to just -$151 billion last year.
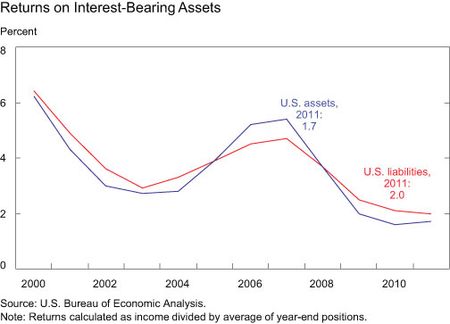
In contrast, U.S. investors earned a much higher rate of return on multinationals’ foreign operations and similar corporate holdings than did foreign investors here, 10.7 percent versus 5.8 percent, respectively. (The comparison is plotted over time in the chart below.) The superior U.S. rate of return on FDI, as well as the greater tilt in U.S. foreign investments toward FDI, accounts for the $322 billion income surplus recorded in this category in 2011.
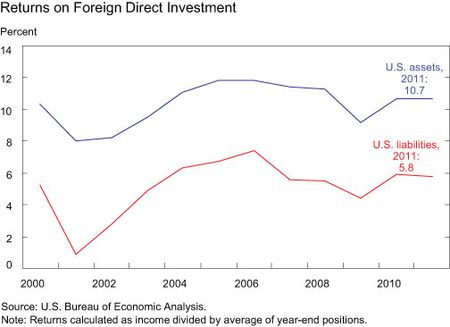
The United States has earned a substantial premium on FDI investments at least since the 1960s. Despite considerable research, there’s no consensus about the key factors behind the persistent U.S. premium. In particular, there’s only mixed support for the theory that the gap reflects U.S. companies’ efforts to book profits in low-tax foreign jurisdictions.
The story for portfolio equity holdings, the third asset category, is relatively straightforward. There was only a small divergence in rates of return in 2011, with U.S. investors earning a dividend-yield of 3.1 percent on holdings overseas and foreign investors earning a dividend-yield of 2.4 percent on holdings here. The U.S. net income surplus of $64 billion in this category is due mostly the larger size of U.S. holdings.
Going Forward
It is difficult to project how the U.S. net income balance will evolve going forward. In particular, we can offer no projection for how relative FDI returns might behave. However, any meaningful narrowing in the current U.S. rate-of-return advantage would cause a substantial deterioration in the net income balance. To take one hypothetical situation, if the rate of return on FDI in the United States matched the current rate of return on U.S. FDI holdings abroad, the U.S. income surplus would now be some $135 billion smaller. As for interest-earning assets, it seems safe to assume that interest rates will eventually rise. Given current holdings, each 100 basis point increase in U.S. and foreign interest rates would raise U.S. income receipts by $72 billion, but add $146 billion to outgoing payments, for a net drag on U.S. net income of almost $75 billion. Moreover, the dollar impact on net income from a rise in interest rates will grow over time as the United States continues to borrow substantial amounts from abroad.
Disclaimer
The views expressed in this post are those of the authors and do not necessarily reflect the position of the Federal Reserve Bank of New York or the Federal Reserve System. Any errors or omissions are the responsibility of the authors.
 Matthew Higgins is a vice president in the Federal Reserve Bank of New York’s Emerging Markets and International Affairs Group.
 Thomas Klitgaard is a vice president in the Federal Reserve Bank of New York’s Research and Statistics Group.


 RSS Feed
 Follow Liberty Street Economics