The pronounced weakness in personal consumption expenditures (PCE) for services has been an unusual feature of the 2007-09 recession and the slow recovery from it. Even in 2010:Q4, when real PCE increased at a relatively robust 4.1 percent annual rate, real PCE on services rose at only a 1.4 percent rate. This weakness has been especially evident in “discretionary” services (to be defined below), which fell more in the recent recession than in previous recessions and since have rebounded more sluggishly. In this post, I suggest that the continued sluggishness in these expenditures lends a note of caution regarding the sustainability of recent PCE strength. Because consumption accounts for about 70 percent of output, this in turn raises some concern about the future strength of the recovery.
Decomposition of Services
In this post, nondiscretionary services expenditures are defined in three broad categories: housing (tenant rent and owners’ equivalent rent), financial services without payment (as these are implicit expenditures), and health care. The remainder of services is considered to be discretionary, and includes categories such as recreation, transportation, food services (including restaurants), and household utilities. Even though all three nondiscretionary categories are large (totaling about 34 percent of total PCE), nearly 47 percent of services expenditures (and about 30 percent of total PCE) are categorized as discretionary in this decomposition.
How Severe Was the Fall in Discretionary Services?
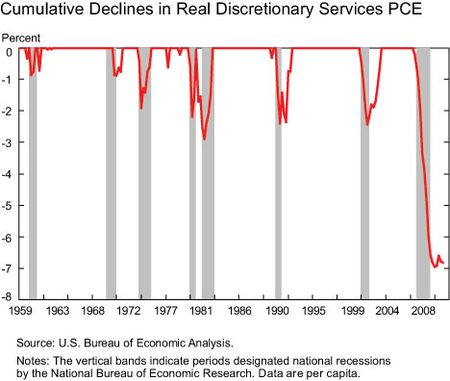
The chart below shows how much real per capita (to account for differing rates of population growth over time) discretionary services expenditures fell from their previous peak—a zero value in this chart means that these expenditures were above their previous peak. The drop in discretionary services expenditures in the last recession was much more severe than in previous recessions: the nearly 7 percent fall from the peak is more than double the percentage decline in the early 1980s recession (the previous “champion” in this dimension).
Furthermore, this outsized fall in discretionary services was an important contributor to the decline in real GDP during the recession. Suppose discretionary services expenditures had fallen about 2 percent in the recession, comparable to the declines in the previous two recessions. With no differences in other GDP components, the peak-to-trough decline in real GDP per capita then would have been about one percentage point less than the actual decrease, which is the difference between a GDP fall similar to previous severe postwar recessions (the 1973-75 and 1981-82 recessions) and the exceptional (about 5 percent) decline that we observed instead.
In contrast to discretionary services, nondiscretionary services expenditures (not shown) fell less during the recent recession than they did in the early 1980s recession, primarily because real health care expenditures held up better in this recession. The exceptional weakness of services PCE in this recession thus appears to be a story of discretionary services.
How Weak Has the Recovery Been in Discretionary Services?
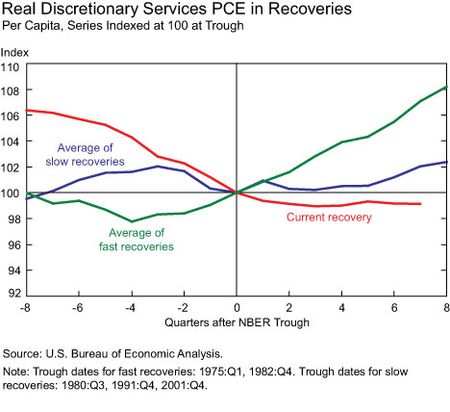
Next, I compare the behavior of real per capita discretionary services expenditures in this recovery to that in “fast” recoveries (the average of those following the 1973-75 and 1981-83 recessions) and in “slow” recoveries (the average of those following the 1980, 1990-91, and 2001 recessions). To do this comparison, the chart below displays an index of real per capita discretionary services expenditures that equals 100 for the quarter at the end of a recession (as determined by the National Bureau of Economic Research). Using this index, we then can evaluate how rapidly these expenditures have recovered since the end of the recession relative to previous economic expansions. This chart shows that the current “recovery” in these expenditures has been exceptionally sluggish, and even slower than that in previous slow recoveries. In fact, these expenditures in 2010:Q4—six quarters after the end of the recession—were still below their level at the trough! As such, these expenditures have been a major contributor to the overall sluggish recovery we have experienced so far.
What Should We Take from These Developments?
Because many of these expenditures can be deferred when economic conditions are strained (for example, eating at home rather than eating out, or passing on the visit to Disney World) and given the increasing share of services in the economy, discretionary services will remain a significant factor in business cycles. In the recent recession, the large rise in unemployment and the sharp drop in household wealth appear to have led households to reduce discretionary services expenditures to a greater extent than we have seen previously, as they attempted to maintain a smoother path of non-discretionary services expenditures.
However, the fact that discretionary services expenditures remain significantly below their previous peaks is of concern for the overall economic outlook. Although these expenditures can be deferred in instances of temporary income drops, the sluggish recovery in these expenditures suggests, consistent with the permanent income/life cycle hypothesis, that households may perceive more persistent shocks to their overall wealth. For example, homeowners may expect house prices to recover only slowly at best, and thus the decline in housing wealth to be more persistent. Also, households may remain wary about their employment and income prospects, suggesting that they may have lowered their future income expectations. Accordingly, the continued sluggishness of discretionary service expenditures at this point in the expansion lends a note of caution regarding the recently improved economic growth outlook.
Disclaimer
The views expressed in this post are those of the author(s) and do not necessarily reflect the position of the Federal Reserve Bank of New York or the Federal Reserve System. Any errors or omissions are the responsibility of the author(s).


 RSS Feed
 Follow Liberty Street Economics
I agree with the life-cycle hyposthesis and the permanent income perceived change to explain why the consumer is more careful but I also suspect that reduced availability to credit might have reinforced the process.