On May 20, the U.S. Department of the Treasury sold a 20-year bond for the first time since 1986. In announcing the reintroduction, Treasury said it would issue the bond in a regular and predictable manner and in benchmark size, thereby creating an additional liquidity point along the Treasury yield curve. But just how liquid is the new bond? In this post, we take a first look at the bond’s behavior, evaluating its trading activity and liquidity using a short sample of data since the bond’s introduction.
Why Was the Bond Reintroduced?
The Treasury has launched a range of new debt products over the years, such as Treasury inflation-protected securities and floating rate notes, and explored the adoption of others, such as an ultra-long 50-year bond. In introducing the 20-year bond, Treasury cited the expected strong demand, which would “increase Treasury’s financing capacity over the long term,” while meeting its objective “to finance the government at the least possible cost to taxpayers over time.” Market participants suggested that the bond could be attractive to liability-driven investors, such as corporate pensions and insurance companies.
Structure Similar to that of Other Notes and Bonds
Like other Treasury coupon securities, 20-year bonds are issued at a price close to par value with a stated rate of interest, pay interest every six months, and are redeemed at par value at maturity. As with the 10-year and 30-year securities, a new 20-year issue is offered each quarter, around the time of the Treasury’s quarterly refunding, with additional amounts offered through scheduled reopenings one and two months later. Coupon and maturity dates are aligned with those of the 10- and 30-year securities, but the bond is auctioned and issued later in the month, to spread auction supply more evenly.
First Issue Meets Strong Demand
The first reintroduced 20-year bond was announced for auction on May 14 with a May 20 auction date, June 1 issuance date, and maturity date of May 15, 2040. The issue faced strong demand at auction, with a high yield (corresponding to the lowest accepted bid price) of 1.22 percent, close to the rate in the when-issued market right before the auction close. The 1.22 percent yield led to a coupon rate of 11/8 percent (coupon rates are set in 1/8 percent increments at the highest increment less than or equal to the high yield). Over $50 billion in bids were submitted for the $20 billion offered, resulting in a bid-to-cover ratio of over 2.5.
The bidder category and investor class allotment data, described in this article, suggest similar buyers at auction as for the 10- and 30-year securities. Primary dealers, which are expected to backstop Treasury auctions, bid for roughly $28 billion of the issue and were awarded just under $5 billion, or 25 percent of the amount offered. Investment funds bought 58 percent of the issue, foreign and international investors 13 percent, other dealers and brokers 4 percent, and all other investors 1 percent (including depository institutions, pension and retirement funds, insurance companies, and individuals).
How We Evaluate the New Bond’s Functioning
We analyze the initial performance of the 20-year bond using a short sample of data from the BrokerTec electronic trading platform. As described in this post, roughly half of Treasury securities trading occurs through interdealer brokers (IDBs), in which dealers and other professional traders transact with one another, and roughly half between dealers and customers. In the IDB market, electronic platforms accounts for about 87 percent of IDB trading, and BrokerTec is estimated to account for 80 percent of electronic IDB trading. As described here, all Treasury security trading through electronic IDBs is in the most recently auctioned (or on-the-run) coupon-bearing securities, so our data for the 20-year bond starts May 21 (the day following the first auction).
Price Behavior Tracks 10- and 30-Year Securities
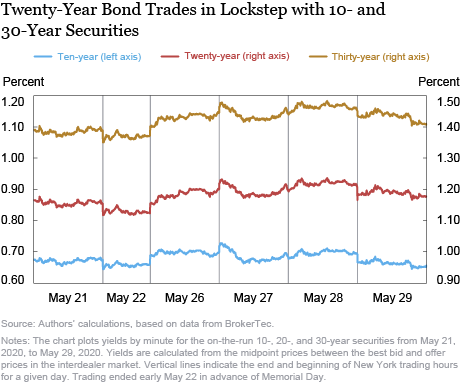
Not surprisingly, the 20-year yield has traded between that of the 10-year note and 30-year bond, with closing yields on May 29 of 0.66 percent (10-year), 1.18 percent (20-year), and 1.41 percent (30-year). Moreover, the 20-year yield traded in lockstep with the 10- and 30-year securities over our short sample, as shown in the chart below. The correlations of 30-minute yield changes during New York trading hours (7:30 a.m. to 5 p.m.) between the 20-year bond and those of the 10-year note and 30-year bond have been 94 percent and 97 percent, respectively.
Trading Activity Is Modest
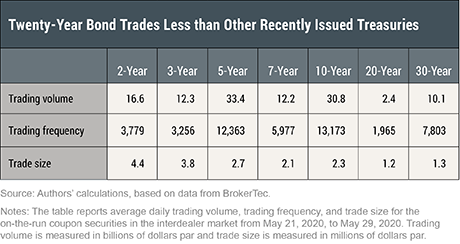
Trading activity of the new bond is much less than that of other recently issued Treasury securities, averaging $2.4 billion per day on the BrokerTec platform over the issue’s short life. Trading frequency—about 2,000 trades per day—is similarly lower than that for other securities. The lower activity may reflect the newness of the security and activity might be expected to increase in the future, as discussed below. Average trade size of $1.2 million is similar to that of the 30-year bond, and just above BrokerTec’s minimum trade size of $1 million. More generally, trade size tends to decrease with the tenor, and hence price sensitivity to rate changes, of the security.
Market Liquidity Similar to that of 30-Year Bond
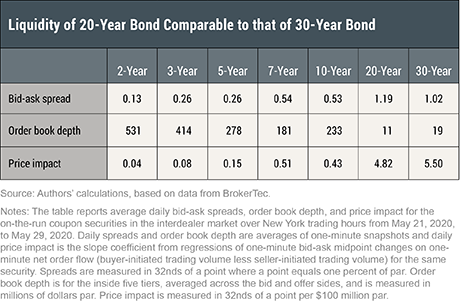
The liquidity of the 20-year bond appears similar to that of the 30-year. Average bid-ask spreads are slightly wider, at 1.2 32nds of a point, vs. 1.0 32nds for the 30-year, with some market makers expressing surprise at the tightness of the 20-year spreads given the security’s newness. Order book depth is appreciably lower, averaging just $11 million at the best five price tiers (averaged across the bid and offer sides), vs. $19 million for the 30-year. Price impact, in contrast, is slightly lower at 4.8 32nds per $100 million vs. 5.5 32nds for the 30-year. More generally, liquidity tends to worsen with the tenor, and hence price sensitivity to rate changes, of the security.
Liquidity Continued to Improve in May
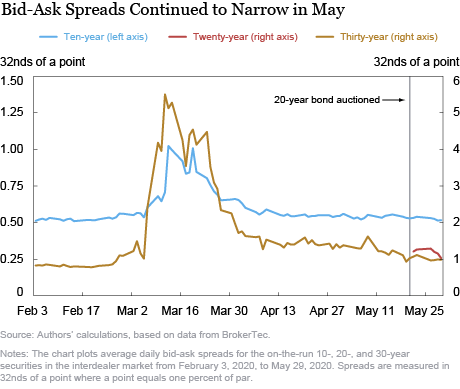
The new 20-year bond was introduced shortly after the historically high level of illiquidity in March 2020, which accompanied increased concerns about the COVID-19 pandemic and its effects on the economy. Market liquidity improved in late March and April, as discussed in this post, and continued to improve in May. The next chart thus shows 10- and 30-year security bid-ask spreads continuing to narrow in May to levels comparable to those of February. Other liquidity measures (not shown) point to improved order book depth and a lower price impact of trades in May for both the 10- and 30-year securities.
Caveats
Our finding that the 20-year bond is less active than other recently issued Treasuries, and of similar liquidity to the 30-year bond, is based on data from the electronic interdealer broker segment of the market. While this segment is generally representative of the broader market, there may be differences across segments we don’t observe. Moreover, there are reasons to think the bond might be more liquid and actively traded in the future. Several large market makers have noted that they are waiting to see how trading and liquidity conditions evolve before starting to trade the security. In addition, the 20-year bond will be reopened twice after its initial issuance, increasing the issue’s size, and larger issues are more liquid. Lastly, as time passes, the supply in the 20-year sector more generally will increase, improving opportunities for relative-value trading, thereby fostering liquidity.
Looking Forward
The government’s borrowing needs have increased sharply as a result of the COVID-19 outbreak, with the Treasury Department stating, for example, that it was expecting to borrow nearly $3 trillion, on net, in the April to June quarter alone. Reintroduction of the 20-year bond is thus just one debt management change among many this year. Treasury is also increasing auction sizes across coupon securities, as it shifts its financing from bills to longer-dated tenors over the coming quarters. Moreover, the possibility of issuing a floating rate note indexed to the Secured Overnight Financing Rate continues. The implications for market liquidity as Treasury issuance evolves will be an ongoing area of interest.

Michael J. Fleming is a vice president in the Federal Reserve Bank of New York’s Research and Statistics Group.
 Francisco Ruela is a senior research analyst in the Bank’s Research and Statistics Group.
How to cite this post:
Michael Fleming and Francisco Ruela, “How Liquid Is the New 20-Year Treasury Bond?,” Federal Reserve Bank of New York Liberty Street Economics, July 1, 2020, https://libertystreeteconomics.newyorkfed.org/2020/07/how-liquid-is-the-new-20-year-treasury-bond.html.
Disclaimer
The views expressed in this post are those of the authors and do not necessarily reflect the position of the Federal Reserve Bank of New York or the Federal Reserve System. Any errors or omissions are the responsibility of the authors.



 RSS Feed
 Follow Liberty Street Economics