Call reports—regulatory filings in which commercial banks report their assets, liabilities, income, and other information—are one of the most-used data sources in banking and finance. Though call reports were collected as far back as 1867, the underlying data are only easily accessible for the recent past: the mid-1980s onward in the case of the FDIC’s FFIEC call reports. To help researchers look farther back in time, we’ve begun creating a complete digital record of this “missing” call report data; this data release covers 1867 through 1904, the bulk of the National Banking Era. Here, we describe the digitization process and highlight some of the interesting features of that era from a research perspective.
Source Material
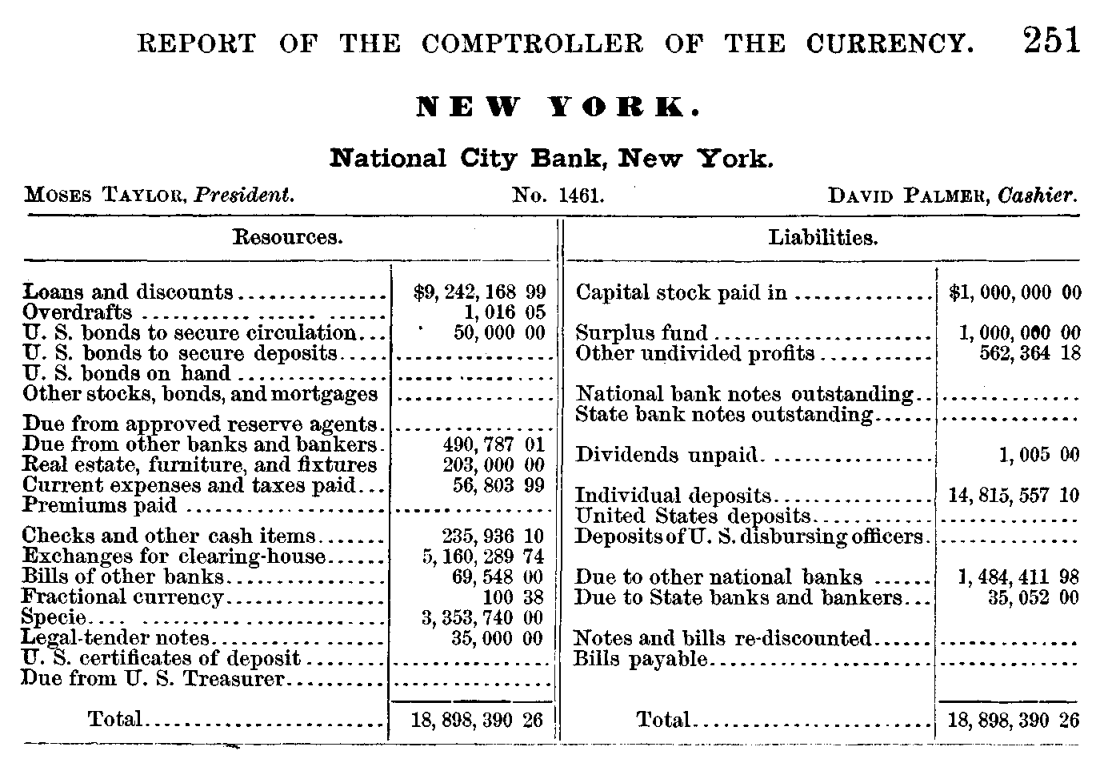
The original source of call report data is the Office of the Comptroller of the Currency (OCC), which published national banks’ balance sheets in its Annual Report to Congress (see the exhibit below for an example of such a balance sheet).
While not as detailed as contemporary regulatory filings such as the FDIC’s call report or the Federal Reserve’s Y-9C, the OCC’s call report is surprisingly granular. For instance, on the asset side, the call report asked banks to report how many outstanding loans and discounts were made, how much cash and governments bonds they are holding, and how much credit is provided to other banks on the interbank market. On the liability side, the call report documents how much equity shareholders have invested in the bank, how much deposit funding the bank has raised, and the amount of bank notes issued by the bank. The OCC’s call report also documented each bank’s location, president, and cashier and assigned a unique charter number to each bank, enabling us to construct a panel.
The Balance Sheet of National City Bank

Digitization Process
We compiled the data by combining optical character recognition (OCR) techniques with modern layout separation techniques to identify the elements of a table. (See our research paper for more on how to collect historical data using OCR.) Ultimately, we created a data set containing more than 110,000 annual national bank balance sheets for more than 7,000 unique national banks, covering the years 1867 to 1904. The quality of the data is quite high. The accuracy can be tested by checking whether the sum of all assets is equal to the sum of all liabilities, which occurs in more than 99 percent of all bank-year observations.
In addition, we augmented the data set with several additional variables. To track banks across time, we created a unique bank identifier containing each bank’s original charter number, as charter numbers sometimes changed on charter renewal. We documented when a bank goes out of business using additional information from the OCC, and distinguished between types of closures, such as receiverships and voluntarily liquidations. Further, we collected information on the location of each bank, recording the relevant city, state, and geographic coordinates.
What Can We Learn from the National Banking Era?
How can this historical data help researchers expand their understanding of banking and financial intermediation?
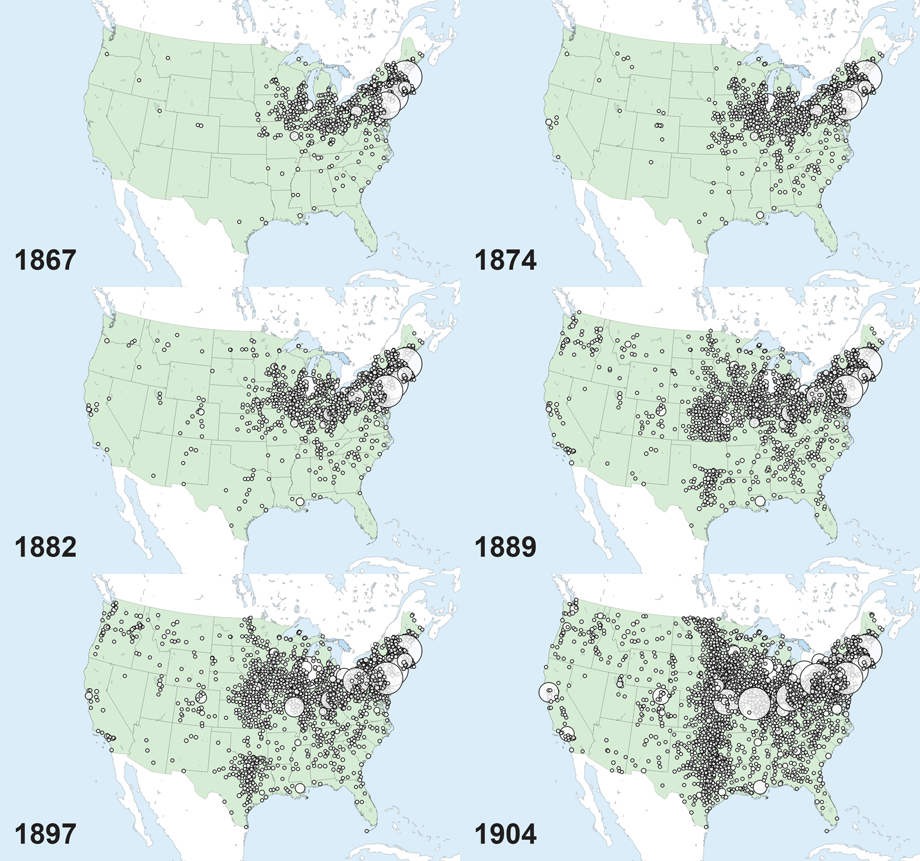
The National Banking Era, which spans the period between the Civil War and the founding of the Federal Reserve System (roughly 1863 to 1913), is an exciting laboratory for empirical banking research. The end of the 19th century was an important phase in world history, with globalization, the modern corporation, and economic growth all taking off at the same time. This was also a period of fast growth and rapid westward expansion for the U.S. banking system, as shown in the animated map below.
Growth of National Banks across Space and Time

Unlike modern banks, national banks were able to issue bank notes, but they otherwise operated much as banks do today, taking deposits and making loans. The regulatory regime of the period, however, was decidedly different. For instance, banks’ geographic footprint was heavily restricted, mostly confining them to the local market, and bank capital requirements posed a barrier to entry for potential competitors rather than a restriction on leverage for incumbent firms. In previous research, we exploited both of these regulatory peculiarities to shed light on classic questions regarding the effects of banking competition.
Sharing the Data
This post marks the public release of this data set. Our current digitization starts in 1867, the first year in which full balance sheets were included in the Report to Congress, and stops in 1904, the last year before a change in the format of the report.

Stephan Luck is a financial research advisor in Banking Studies in the Federal Reserve Bank of New York’s Research and Statistics Group.
Sergio Correia is an economist in the Financial Stability Division at the Board of Governors of the Federal Reserve System.
How to cite this post:
Stephan Luck and Sergio Correia, “Insights from Newly Digitized Banking Data, 1867‑1904,” Federal Reserve Bank of New York Liberty Street Economics, March 6, 2023, https://libertystreeteconomics.newyorkfed.org/2023/03/insights-from-newly-digitized-banking-data-1867-1904/
BibTeX: View |
Disclaimer
The views expressed in this post are those of the author(s) and do not necessarily reflect the position of the Federal Reserve Bank of New York or the Federal Reserve System. Any errors or omissions are the responsibility of the author(s).


 RSS Feed
 Follow Liberty Street Economics